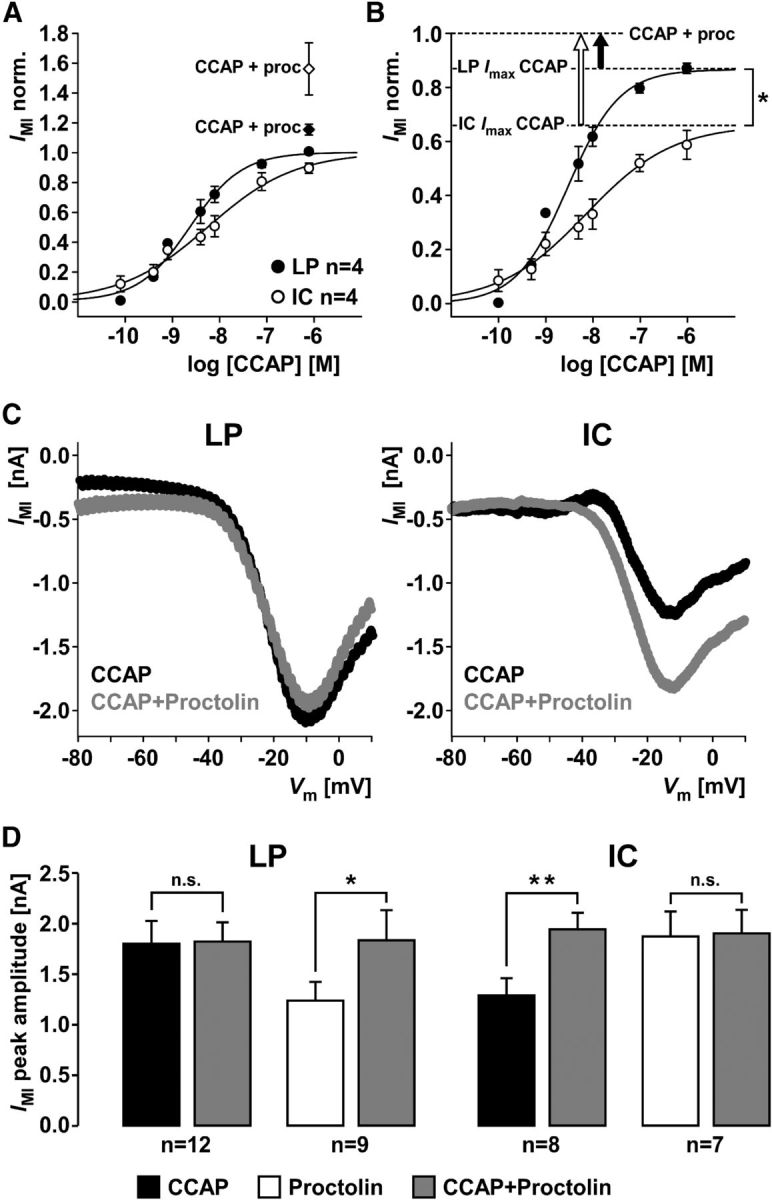
Figure 8.

Differences in occlusion of IMI activation by CCAP and proctolin between LP and IC. A, Mean current values at different CCAP concentrations from measurements at −20 mV in LP and IC, normalized to the maximal current fit value in each experiment. After the concentration series of CCAP, a mix of 1 μm CCAP and 1 μm proctolin was added. Addition of proctolin yielded larger currents (diamonds) than saturating CCAP concentrations alone (circles). B, Same data from the CCAP concentration series as in A, but normalized to the responses to the mix of CCAP and proctolin. Addition of proctolin yielded a significantly larger increase in current in IC than in LP (unpaired t test, p < 0.05). C, Example IV curves generated from the difference of responses to voltage ramps in control saline, 1 μm CCAP, and 1 μm CCAP + 1 μm proctolin. Peak current amplitude did not change in LP but increased in IC. D, Mean peak current amplitudes across experiments, measured from IV curves as shown in C. Current amplitudes in LP did not change between CCAP alone and CCAP + proctolin (paired t test, p = 0.89). In contrast, current amplitudes in IC significantly increased between CCAP alone and CCAP + proctolin (paired t test, p < 0.01). When proctolin was applied alone first, adding CCAP significantly increased current amplitudes in LP (paired t test, p < 0.05), but not IC (paired t test, p = 0.81). *p < 0.05. **p < 0.01. n.s., Not significant.
