
Figure 2.
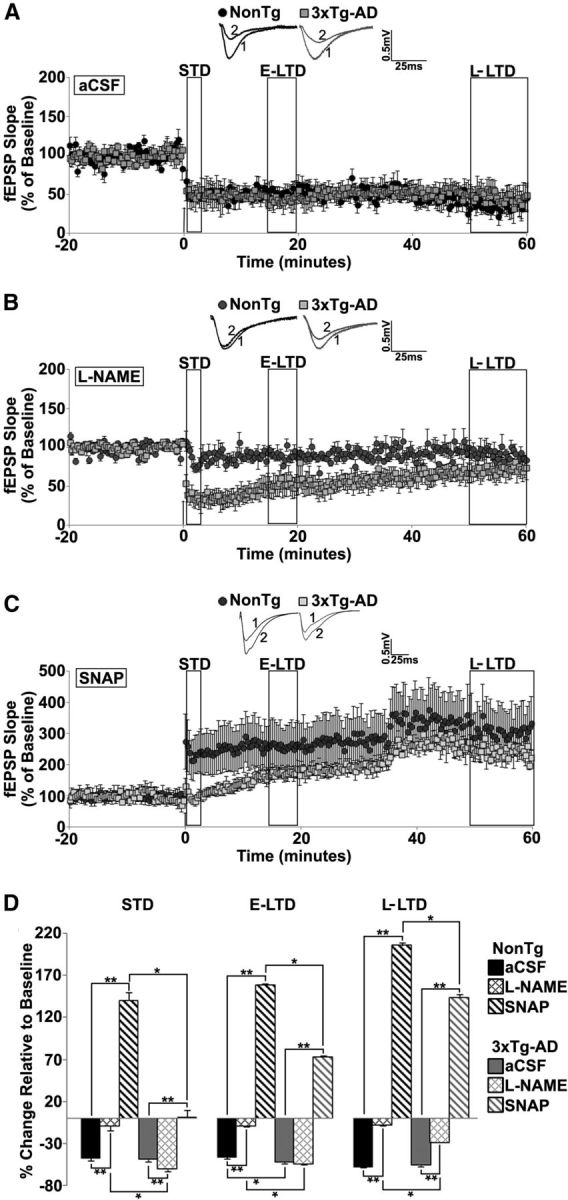
NO maintains long term depression in young 3xTg-AD mice. A–C, Graph shows averaged time course of LTD from NonTg and 3xTg-AD mice in aCSF (A), l-NAME (B), and SNAP (C). Insets, Representative baseline traces before (1) and after (2) LFS from NonTg (black) and 3xTg-AD (gray) mice. D, Bar graph shows percentage change in post-LFS responses relative to baseline 0–2 min after LFS (STD), 15–20 min after LFS (E-LTD), and 50–60 min after LFS (L-LTD). The arrow denotes the time at which the LFS (900 pulses at 1 Hz) was administered; *p < 0.05 indicates significantly different from NonTg; **p < 0.05 indicates significantly different from control aCSF-treated slices.