
Figure 5.
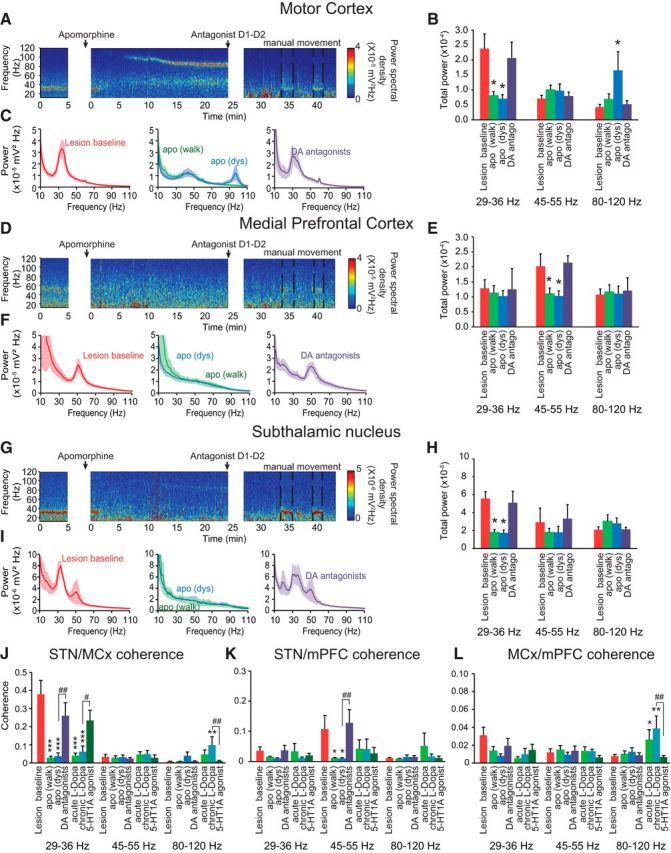
Effects of acute injection of the dopamine agonist apomorphine (0.5 mg/kg) and acute and chronic l-DOPA (12 mg/kg) treatment on MCx, mPFC, and STN power and coherence after dopamine depletion. A, D, G, Representative FFT-based scalograms represent the time-frequency plots of LFP spectral power in the MCx (A–C), mPFC (D–F), and STN (G–I) 21 d after dopamine depletion before any treatment (left); after apomorphine injection (middle); and after a mix of D1 and D2 receptor antagonist (SCH-23390, 0.3 mg/kg, and eticlopride, 0.2 mg/kg) injection (right). D1 and D2 antagonists were injected 25 min after apomorphine to reverse its effect. Since these antagonists induced catalepsy, rats were manually moved to induce the urge to walk (dashed lines). Spectral power was plotted on a logarithmic scale with greater power represented by red colors. C, F, I, Linear graphs show averaged LFP power spectra (10–110 Hz) in the MCx (C; n = 6–9 rats), mPFC (F; n = 6–9 rats), and STN (I; n = 7–9 rats) 21 d after dopamine depletion before treatments (left, red), after apomorphine injection [middle, green, during walking <10 min after injection, and blue, during dyskinesia (dys), 10–25 min after injection] and after SCH-23390/eticlopride injections during manual movement epochs (right, purple). B, E, H, Bar graphs represent mean total LFP power in the MCx (B; n = 6–9 rats), mPFC (E; n = 6–9 rats), and STN (H; n = 7–9 rats) within three frequency ranges: high beta (29–36 Hz), low gamma (45–55 Hz), and high gamma (80–120 Hz). Recordings were done 21 d after dopamine depletion before any treatment (red), after apomorphine injection, <10 min after injection (green), and >10 min after injection when rats presented a dyskinetic behavior (blue) and after SCH-23390/eticlopride injections during manual movement (right, purple). J, K, L, Bar graphs represent mean total LFP coherence between STN and MCx (J; n = 6–9 rats), STN and mPFC (K; n = 6–9 rats), and MCx and mPFC (L; n = 6–9 rats); after dopamine depletion before treatments (red); after apomorphine injection (dark blue); after SCH-23390/eticlopride injections during manual movement epochs (purple); after acute l-DOPA injection (light green); after 7 d of chronic l-DOPA treatment (light blue); and after 5-HT1A injection (8-OH-DPAT), given 85 min following the last l-DOPA injection. These coherences were analyzed within three frequency ranges: high beta (29–36 Hz), low gamma (45–55 Hz), and high gamma (80–120 Hz). Values are reported as mean ± SEM, *p < 0.05, **p < 0.01, ***p < 0.001 significant difference from lesion baseline; #p < 0.05, ##p < 0.01, significant difference from previous treatment, one-way ANOVA followed by a Fisher LSD test.