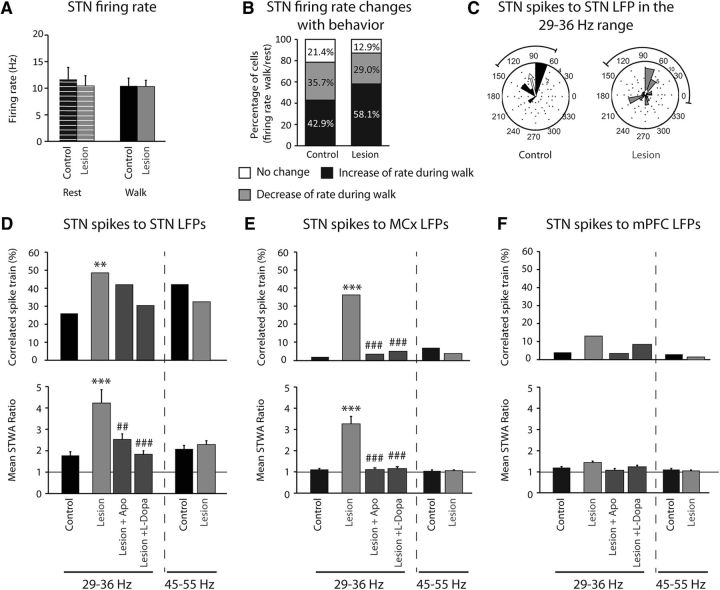
Figure 6.
Effect of dopamine cell lesion on STN firing rate and spike-LFP phase locking with STN LFP, MCx LFP, and mPFC LFP filtered in the high beta 29–36 Hz and the low gamma 45–55 Hz frequency ranges during rest and treadmill walking. A, Firing rate of STN in control (black; n = 28 cells from 8 rats) and 21 d after dopamine depletion (gray; n = 32 cells from 9 rats) during rest (stripes) and treadmill walking (full). B, Percentage of STN cells showing an increase of rate during walk compared with rest (black; control: n = 12 cells; lesion: n = 19), a decrease (gray; control: n = 10 cells; lesion: n = 9), or no change (white; control: n = 6 cells; lesion: n = 4) in control and 21 d after dopamine depletion. C, Phase plots showing the distributions of phase relationships between STN spikes and STN LFPs filtered between 29 and 36 Hz for spike trains showing significant phase locking to local LFP in control (n = 13 spike trains from 8 rats) and lesion (n = 33 spike trains from 9 rats). Spikes were significantly oriented to high beta STN LFP oscillations; Rayleigh test: p < 0.05. Arrows reflect a measure of the strength of concentration of the distribution of the mean phase values, normalized to the radius of the circular plot. D–F, Top, Percentage of significantly correlated subthalamic spike trains to subthalamic LFPs (D), to MCx LFPs (E), and to mPFC LFPs (F) within two frequency ranges: high beta (29–36 Hz) and low gamma (45–55 Hz). Bottom, Mean ratios of peak-to-trough amplitude of unshuffled/shuffle STWA of subthalamic spike trains to subthalamic LFPs (D), to MCx LFPs (E), and to mPFC LFPs (F) within two frequency ranges: high beta (29–36 Hz) and low gamma (45–55 Hz). Two walk epochs were analyzed in control (n = 50 spike trains, n = 8 rats), lesion (n = 68 spikes trains, n = 9 rats), and after apomorphine injection before dyskinesia (n = 64 spike trains, n = 8 rats), and only the epochs corresponding to 60 min after l-DOPA injection, during dyskinesia, were analyzed (n = 29 spike trains from 5 rats). Values are reported as percentage or mean ± SEM, **p < 0.01, ***p < 0.001, significant difference from control animals, ##p < 0.01, ###p < 0.001, significant difference with lesion animals 21 d after dopamine depletion before treatments; one-way ANOVA followed by a Fisher test.

