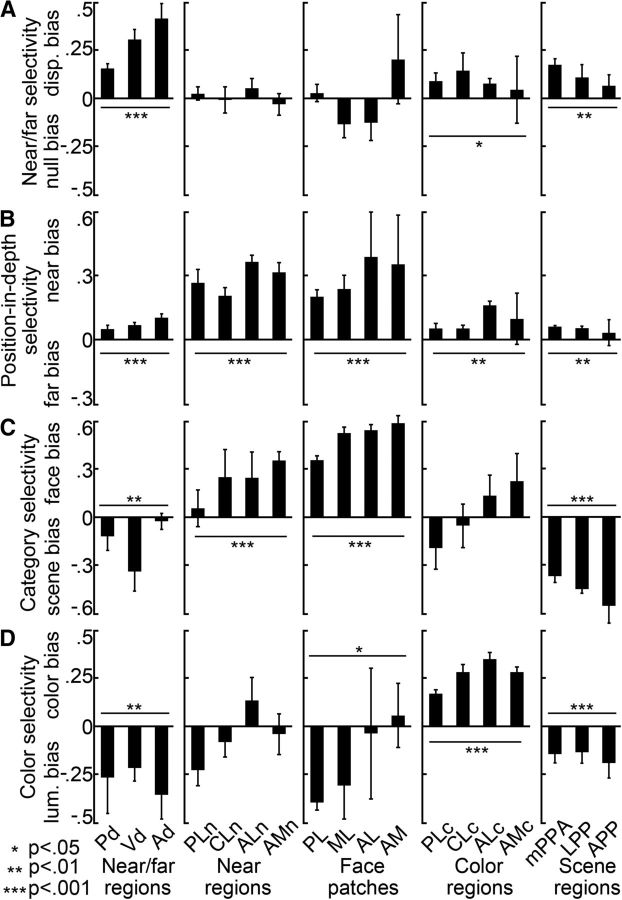
Figure 11.
Quantification of near/far, position-in-depth, face, scene, and color selectivity in IT in independent datasets. Selectivity indices were computed using half of the data. The selectivity indices for the near/far disparity-biased regions in IT are shown in the first column. Second column, Near disparity-biased regions in IT. Third column, Face patches in IT. Fourth column, Color-biased regions in IT. Fifth column, Scene-biased regions in IT. A, Near/far selectivity (near + far disparity − null)/(near + far disparity + null), in the different IT patches. Activity in the color- and scene-biased regions was near/far disparity biased (p = 0.02 on the near/far selectivity indices of the N = 16 color regions of all four hemispheres; p = 0.003 for the N = 12 scene-biased regions; bootstrap t test), but less selective than the IT's near/far disparity-biased regions (p = 0.003 for the color regions; p = 0.004 for the scene-biased regions; unpaired permutation t test). B, Position-in-depth selectivity (near disparity − far disparity)/(near disparity + far disparity), in the different IT patches. All patches, regardless of their definition (i.e., face, color, scene, or stereo), demonstrated a preference for nearer stimuli (p < 0.01 for face, color, scene, and disparity patches; bootstrap t test). The near bias in the color-, scene-, and near/far disparity-biased regions was small compared with that in the near disparity-biased regions (p < 10−5, unpaired permutation t test). The preference for near stimuli was comparable in the face- and near disparity-biased regions (p = 0.9, unpaired permutation t test). C, Face/scene category selectivity in the different IT patches. Face/scene selectivity was defined as the responses to (faces − scenes)/(faces + scenes), with positive values corresponding to a preference for faces and negative values corresponding to a preference for scenes. Responses in near disparity-biased regions were face selective (p < 10−4, bootstrap t test), but not as face selective as the responses in the face-biased regions of IT (p = 3 × 10⁻⁴, unpaired permutation t test on the face-selectivity indices corresponding to all near biased, N = 16, and all face-biased, N = 16, regions of all hemispheres). Responses in the near/far disparity-biased regions were on average scene-biased (p < 0.01). D, Color selectivity in the different IT regions. Color selectivity was defined as the responses to (weakest color − luminance)/(weakest color + luminance), with positive values corresponding to a preference for colors. Color selectivity was highest in the color-biased brain regions (p < 2 × 10⁻⁴ for the comparisons between the color-selectivity indices of the near/far disparity-, near disparity-, face-, scene-biased regions, and those of the color-biased regions; unpaired permutation t test). The near disparity-, near/far disparity-, face-, and scene-biased regions were generally more strongly activated by achromatic stimuli than by colored stimuli (p < 0.05 for the near/far disparity-, face-, and scene-biased regions; p > 0.05 for the near disparity-biased regions; bootstrap t test). Asterisks refer to the results of a statistical test comparing the average selectivity within an area to zero (bootstrap t test): *p < 0.05, **p < 0.01, ***p < 0.001. Error bars indicate SEM. Same ROI-naming conventions as before.

