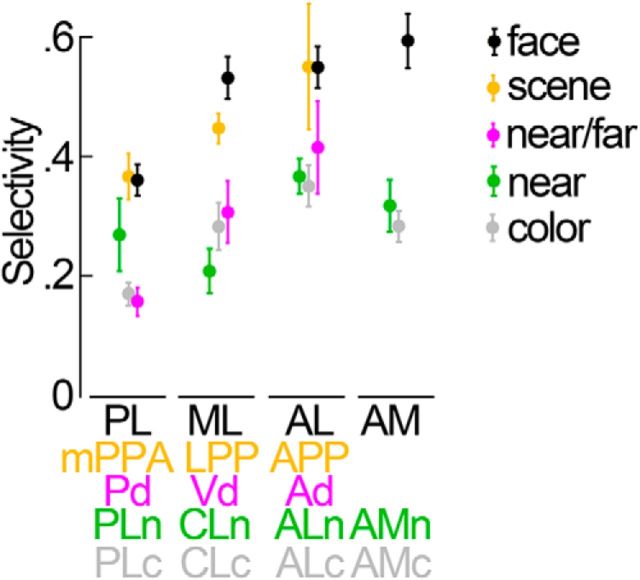
Figure 12.
Summary of the selectivity in the different ROIs in IT. Mean face selectivity is given in black for the different face patches (PL, ML, AL, and AM). Mean scene selectivity is given in orange for the different scene-biased areas (mPPA, LPP, and APP). Mean near/far disparity selectivity is given in magenta for the three near/far disparity-biased areas (Pd, Vd, and Ad). Average near selectivity is shown in green for the four near disparity-biased areas (PLn, CLn, ALn, and AMn). The average color selectivity for the four color-biased regions is shown in gray: PLc, posterolateral; CLc, centrolateral; ALc, anterolateral; AMc, anteromedial. Error bars indicate SEM.

