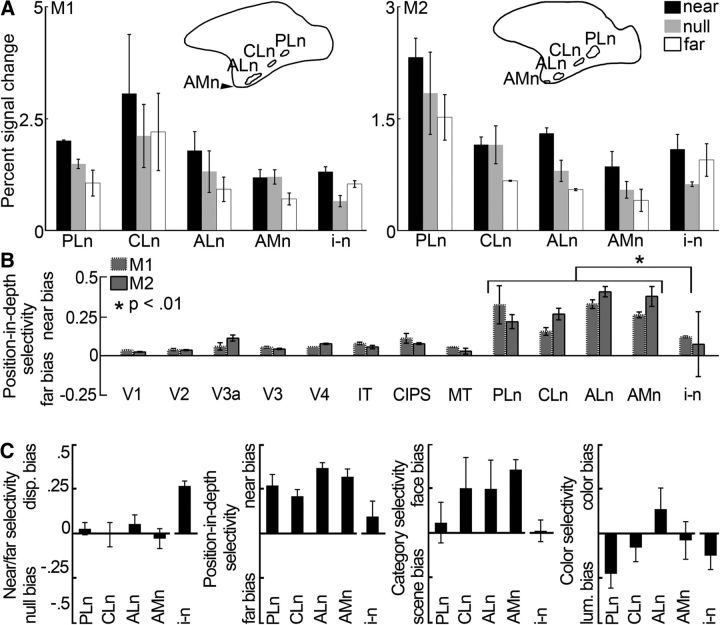
Figure 7.
Quantification of the near disparity-biased activity in an independent dataset. Quantification was performed on half of the data from Experiment 2. ROIs were defined using the other half of the data from Experiment 2. A, Average percentage signal change to stimuli with near disparity (black), far disparity (white), and without disparity (gray) in the near disparity-biased ROIs in IT. PLn, Posterolateral; CLn, centrolateral; ALn, anterolateral; AMn, anteromedial; i-n, interstitial near disparity-biased region. Left, Monkey M1. Right, Monkey M2. Pictograms represent the location of ITs near disparity-biased regions for each monkey. B, Average position-in-depth selectivity, defined as the responses to (near − far)/(near + far) (see Materials and Methods), per area and monkey. Positive values correspond to increased responses to near stimuli (near bias); negative values indicate stronger responses to far stimuli (far bias). Some near disparity-biased activity was observed in all examined areas. Responses in the three near/far disparity-biased regions Pd, Vd, and Ad were near biased (p < 0.001 bootstrap t test on the near-selectivity indices associated with the near/far disparity-biased regions of all four hemispheres, N = 12, N = 3 per hemisphere), although less pronounced than in the near disparity-biased regions (p < 10−6, unpaired permutation t test on the position-in-depth selectivity indices of the near [N = 16] and near/far disparity-biased [N = 12] regions). The average near bias in the interstitial IT region i-n was smaller than that in the near disparity-biased IT regions (see asterisk; p = 0.007, unpaired permutation t test comparing the position-in-depth selectivity indices from all four hemispheres' near disparity-biased regions [N = 16] with those of the interstitial regions of all four hemispheres [N = 4]). C, From left to right, Near/far selectivity, position-in-depth selectivity, face/scene selectivity, and color selectivity in the interstitial- and near disparity-biased regions in IT. Error bars indicate SEM.

