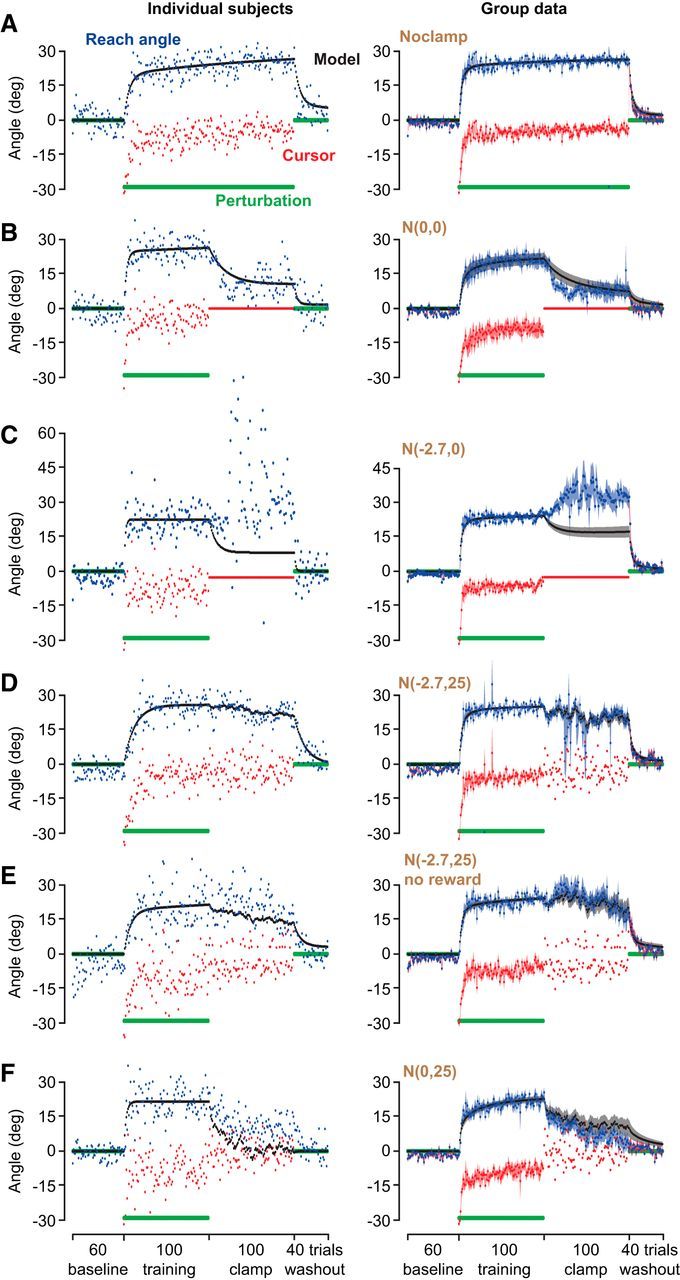
Figure 2.

Behavior of typical subjects (left) and groups (mean ± SEM across subjects; right) for the No clamp (A), N(0, 0) (B), N(−2.7, 0) (C), N(−2.7, 25) (D), N(−2.7, 25) (E) no reward, and N(0, 25) (F) groups. Green lines indicate the rotation angle. Red points indicate cursor feedback. Blue points indicate the reach angle. A state-space model was fit to the baseline and training data for each subject. The parameters from that fit were fixed and used to predict behavior in the clamp and washout periods. Black lines indicate the predictions of the model (mean ± SEM across subjects).
