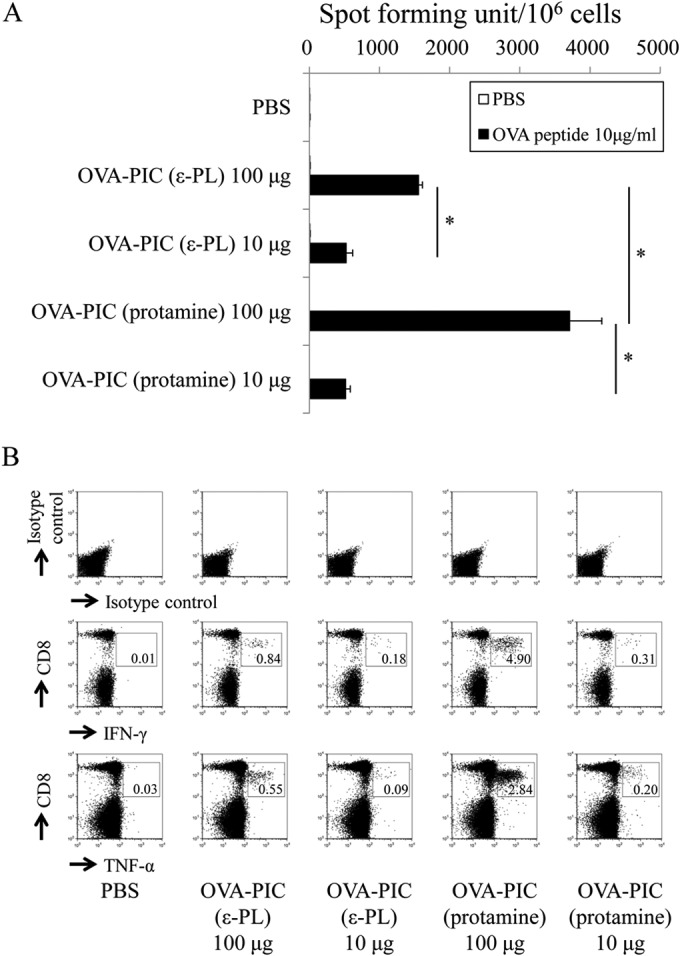
FIG 7.

Functional analysis of antigen-specific cytokine-producing T cells induced by OVA-PIC NPs containing different cationic proteins. Mice (n = 3) were subcutaneously immunized twice with PBS, OVA-PIC (ε-PL) 100 μg (1 mg of γ-PGA-Phe, 200 μg of ε-PL, and 100 μg of OVA), OVA-PIC (ε-PL) 10 μg (100 μg of γ-PGA-Phe, 20 μg of ε-PL, and 10 μg of OVA), OVA-PIC (protamine) 100 μg (1 mg of γ-PGA-Phe, 200 μg of protamine, and 100 μg of OVA), or OVA-PIC (protamine) 10 μg (100 μg of γ-PGA-Phe, 20 μg of protamine, and 10 μg of OVA). Spleen cells were isolated on day 14 after the final immunization. (A) Spleen lymphocytes were stimulated with no peptide (PBS) or the OVA257–264 CTL epitope peptide (10 μg/ml) and evaluated for their IFN-γ production by ELISPOT. Data are expressed as the numbers of IFN-γ-positive spots per million cells. Data represent the mean result ± SD for each group. Statistical analysis was carried out among the 4 groups stimulated with the OVA257–264 epitope peptide (10 μg/ml) (*, P < 0.05). (B) Spleen lymphocytes were stimulated with the OVA257–264 peptide and examined for their production of IFN-γ and TNF-α by intracellular cytokine staining. The number in each panel indicates the percentage of cytokine-positive CD8+ T cells.
