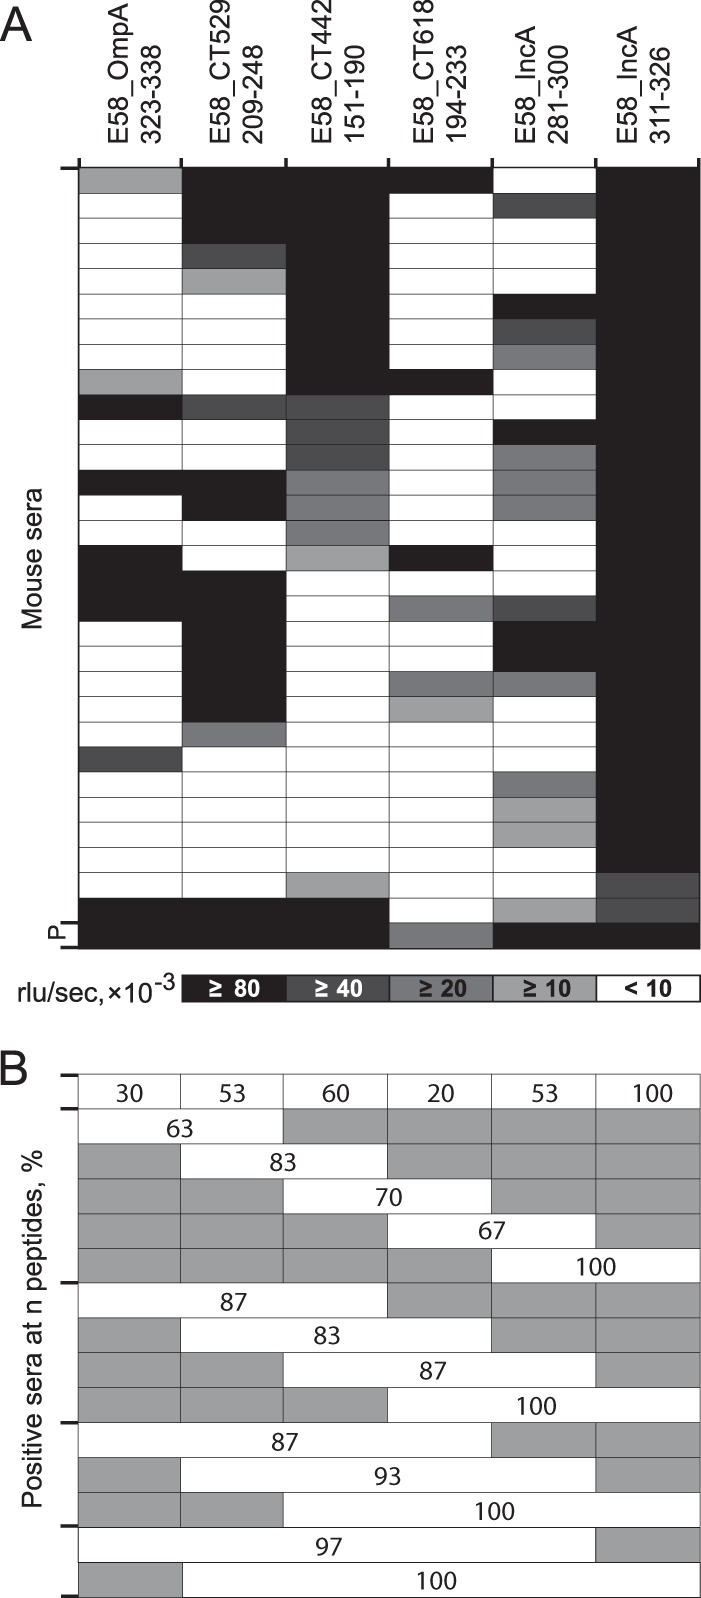
FIG 4.

Reactivity of C. pecorum-specific individual mouse sera with C. pecorum peptides. (A) Heat map of reactivity of 30 mouse sera with six peptides designed from five proteins (OmpA, CT529, CT442, CT618, and IncA) of C. pecorum strain E58. Shading intensity is proportional to peptide reactivity with each serum (mean of two experiments, interassay CV = 8.5%), with a cutoff of 10,000 RLU/s. P indicates the pool of all mouse sera. The mean of all 15 ratios of the six peptide ELISA reactivities of all 30 sera (positive and negative) versus that of only positive sera is 3.57 versus 1.60 (P = 0.046; Student t test), indicating that the percentage of positive sera has a 2.23-fold-higher influence on the level of reactivity of the pool of all 30 sera than the amplitude of reactivity of individual positive sera. In other words, the number of positive sera among all sera of the pool has a 2.23-fold-higher influence on the signal amplitude of the serum pool than the signal amplitude of the individual positive sera of the pool. (B) Combined percent seropositivity of these single and multiple C. pecorum E58 peptides. Shaded areas indicate peptides not included in the combined reactivity of the evaluated peptides.
