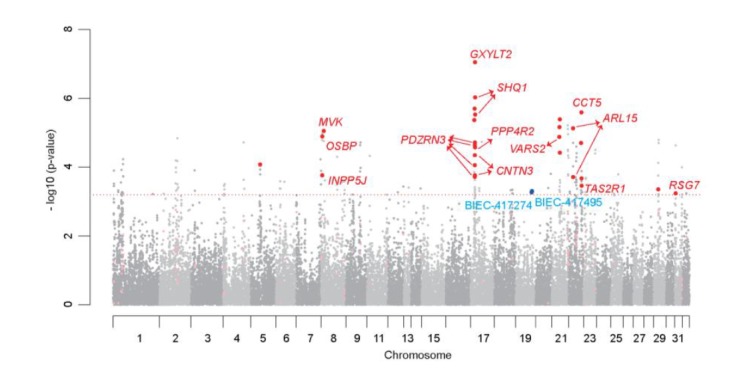
Figure 2.

Manhattan plot of genome-wide association with the estimated breeding value for race time (Stage 1). In this plot, results are plotted as negative log-transformed p-values from the genotypic association test (observed −log 10 p-values by position); Result of stage 1 is shown in two different gray colors. Odd chromosome numbers are in dark grey, and even chromosome numbers in light grey. The red horizontal dotted line indicates stage 2 threshold. Single-nucleotide polymorphisms (SNPs) in stage 2 are shown in two red colors. Significant SNPs with a p-value less than threshold are in red, and others are in light red. Reported SNPs that associated with racing performance of Thoroughbred are in blue.
