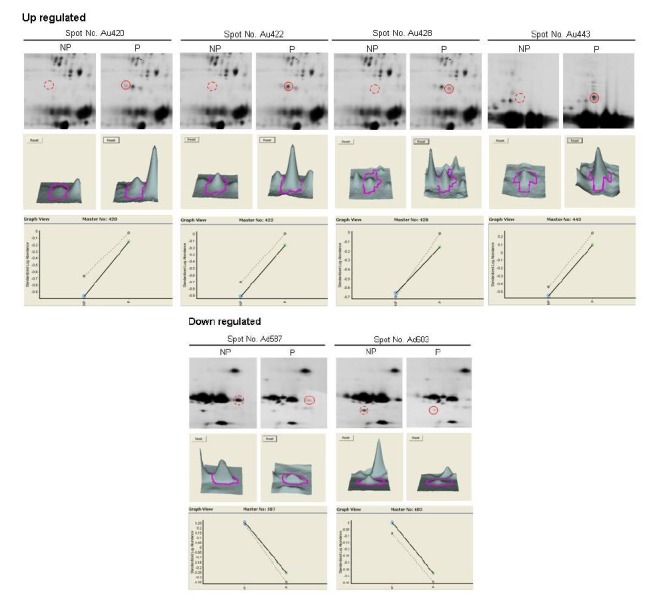
Figure 2.

Differentially expressed protein spots of pH 3-10NL. The spot pairs of up-regulated and down-regulated proteins in bovine serum were shown, with the DeCyder matched spots (NP, non-pregnancy bovine serum, P, pregnancy bovine serum). 3D representation of spot volumes derived from differentially expressed proteins. Graphical representations of all matched spots for particular protein are shown in the lower panels (dotted and solid lines were plotted with two independent values from the two sets of gels in which pregnant and normal samples ran).
