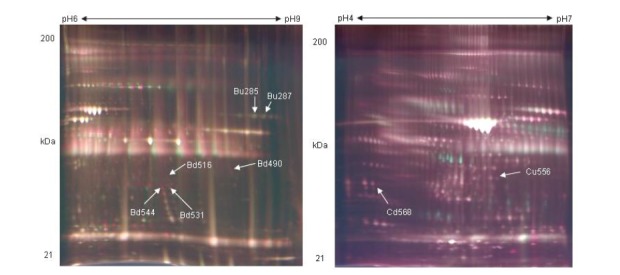
Figure 3.

2D difference gel electrophoresis gel image and differentially expressed protein spots of pH 6 to 9. The spot pairs of up-regulated and down-regulated proteins in bovine serum were shown, with the DeCyder matched spots (NP, non-pregnancy bovine serum; P, pregnancy bovine serum). 3D representation of spot volumes derived from differentially expressed proteins.
