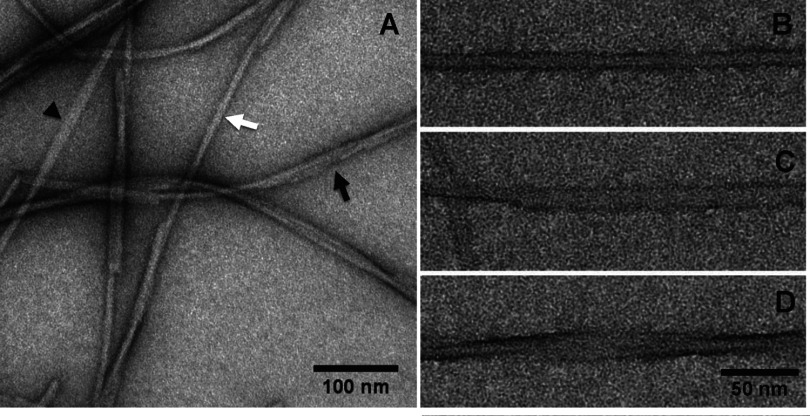
Figure 1. TEM negative staining micrographs showing Hfq C-terminal fibres.
(A) General microscopy field of Hfq C-terminal sample, illustrating the heterogeneity in fibres organization: closed (white arrow), opened (arrowhead) and twisted (black arrow) fibres. (B–D) Close-up views of closed, opened and twisted fibres respectively. Scale bars are 100 nm (A) and 50 nm (B–D).

