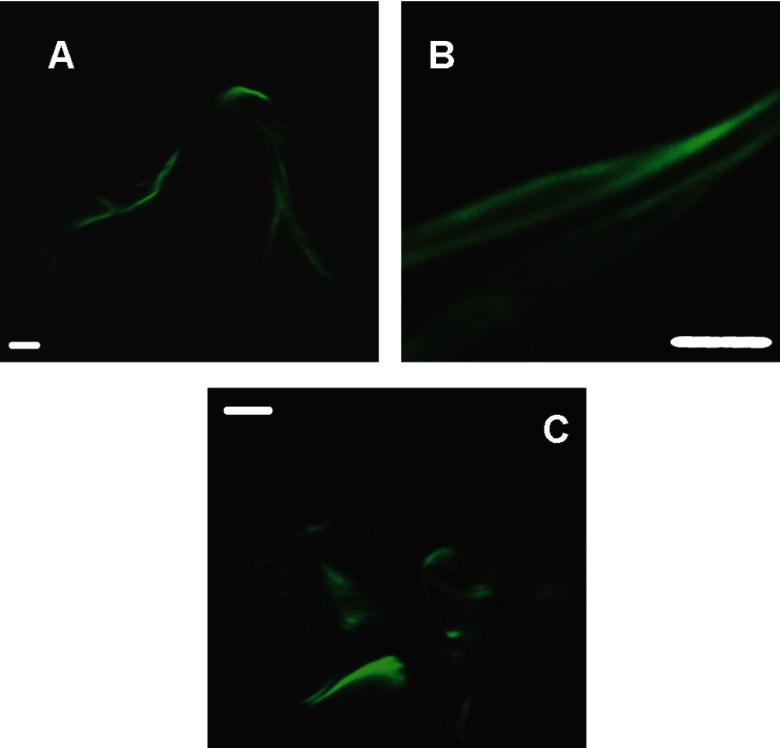
Figure 3. Confocal microscopy fluorescence images for CTR Hfq fibrils.
Samples (Hfq-CTR peptide) were stained by ThT as indicated under ‘Experimental’ section. (Scale bar=5 mm). Distinct morphologies are present in the sample: laterally packed fibrils bundles (A and B) or clustered wires (C). Scale bar=5 μm.

