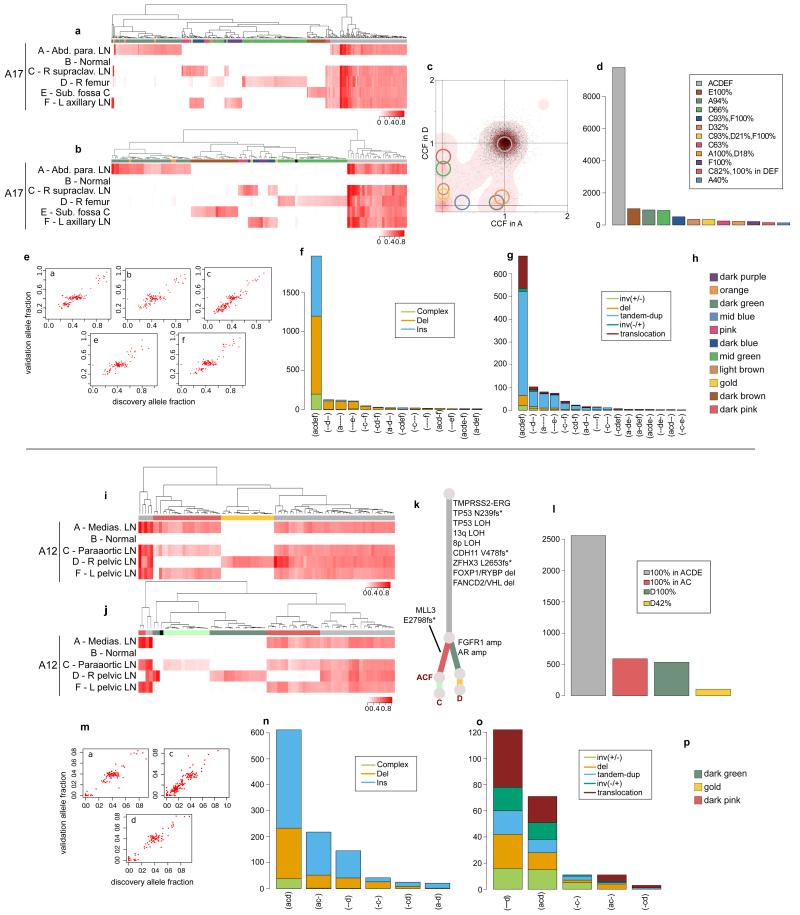
Extended Data Figure 6. Validation of the subclonal hierarchies in A17 and A12.
Validation strategy as described in Extended Data Figure 2. For A17 and A12, hierarchical clustering of the VAF was performed separately for substitutions (a) and (i) and indels (b) and (j). Heatmaps are annotated as described in Extended Data Figure 2. Mutations that could not be assigned to any cluster are annotated with black. For A12, the C-specific cluster that is not present in substitutions is shown in very light green. Subclones for A17 AD are annotated in the 2d-DP plot (c). Numbers of substitutions in WGS data assigned to each subclone are plotted in (d) and (l). VAFs from WGS and validation data, plotted as scatter plots (e) and (m), are very highly correlated. Number of indels (f) and (n) and rearrangements (g) and (o) present in different subsets of samples are plotted as bar charts. Additional samples for A12 are incorporated into the phylogenetic tree (k). Subclone Colour keys for A17 and A12 (h and p) respectively.

