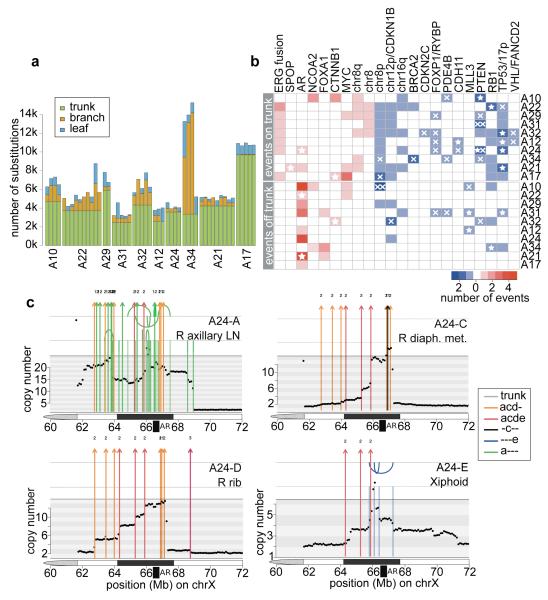
Figure 4. Drivers of tumorigenesis are truncal while drivers of castration resistance are convergent.
(a) Proportion of trunk, branch and leaf mutations in each sample. (b) Heatmap of oncogenic alterations present on the trunk (top) or off the trunk, i.e. on branches or leaves (bottom). Alterations in oncogenes and tumour suppressors are shown in red and blue, respectively, with shade indicating the number of events in that patient. Focal deletions and substitutions/indels are shown with crosses and stars, respectively. Double crosses indicate homozygous deletions resulting from deletions of both alleles. (c) Continuous selective pressure on AR signalling is observed in the form of multiple rearrangements resulting in multiple copy number increases at the AR locus within the same patient. Chromosomal rearrangements are plotted on top of the genome-wide copy number for each of the 4 WGS samples from A24. Rearrangements are coloured according to the colour code in Supplementary Table 3. Arcs above and below the top vertical line indicate deletion and tandem duplication events, while arcs above and below the second vertical line are head-to-head and tail-to-tail inversions, respectively.

