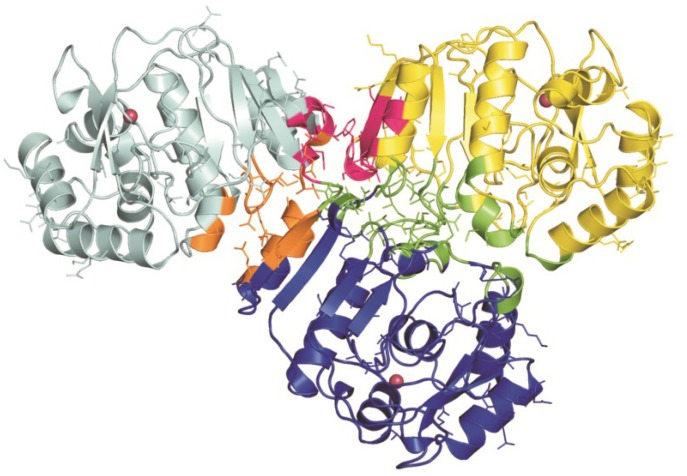
Figure 4.
Model of the CDCA1 full length. R1 (cyan), R2 (blue) and R3 (yellow) are shown in cartoon representation. Interface regions are displayed in orange (R1-R2), green (R2-R3) and magenta (R1-R3). Non conserved residues are displayed in ball-and-stick and the three metal ions are reported as pink spheres.

