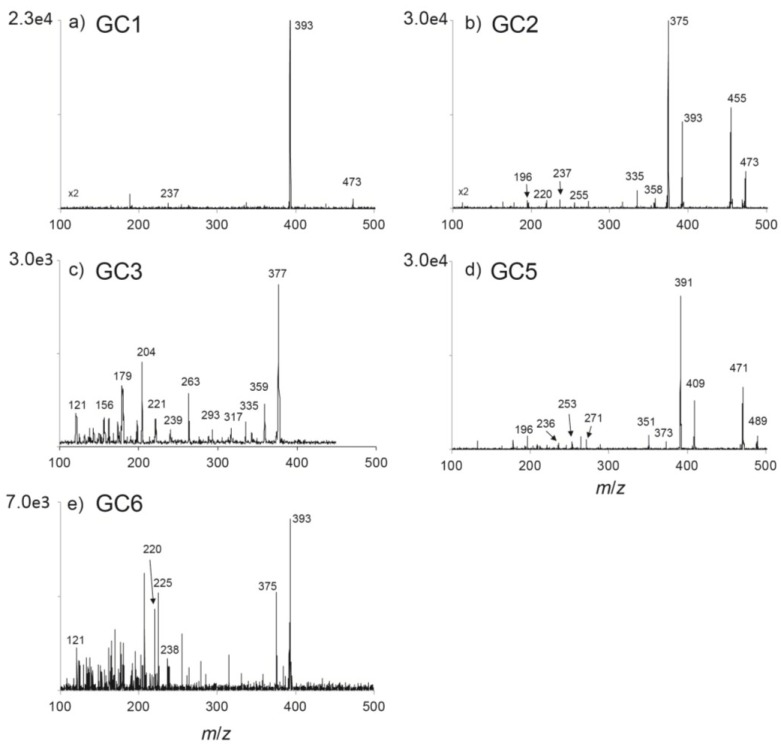
Figure 4.
Product ion spectra of GC toxins identified in a Gymnodinium catenatum culture isolated from the Portuguese coast in 2007: (a) m/z 473 of GC1; (b) m/z 473 of GC2; and (c) m/z 377 of GC3; (d) m/z 489 of GC5; and (e) m/z 393 of GC6. The [M + H]+ ions were selected from full scan analyses and fragmented to achieve the maximum abundance of product ions.

