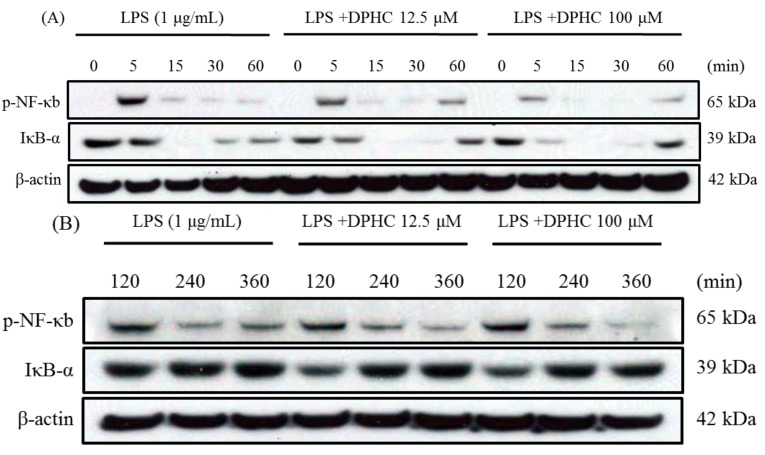
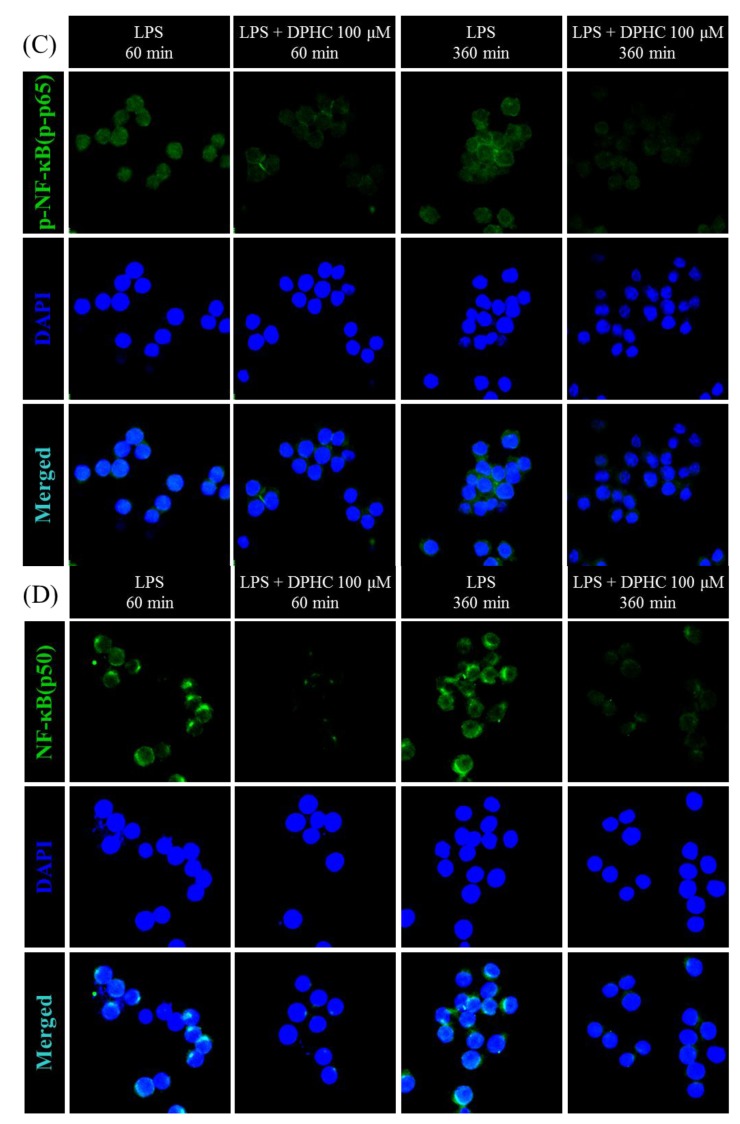
Figure 2.
Effect of DPHC on the NF-κB pathway in LPS-stimulated RAW 264.7 cells. (A,B) Cells (7.5 × 10⁵ cells/mL) were stimulated with LPS in the presence or absence of DPHC. Whole cell lysates were obtained at the indicated time points. NF-κB phosphorylation and IκB-α degradation were assessed by Western blotting from whole cell lysates; (C,D) Cells (2.0 × 10⁵ cells/mL) were stimulated with LPS in the presence or absence of DPHC for the indicated time intervals. The images were acquired at constant photomultiplier (PMT), gain, offset, magnification (40× oil immersion objectives with a zoom factor of 3.0) and resolution.


