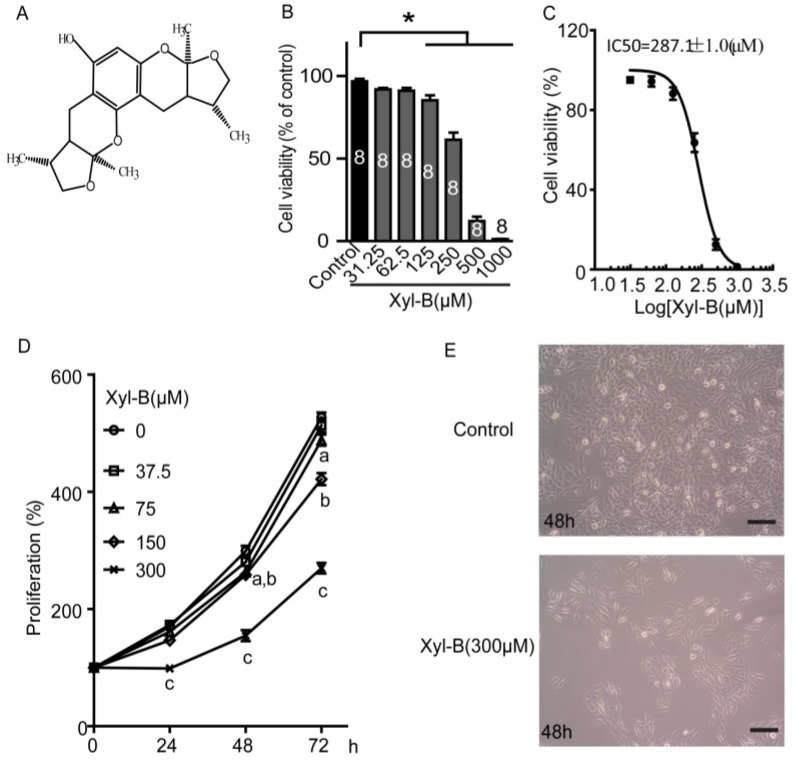
Figure 1.
Effects of xyloketal B (Xyl-B) on cell viability and proliferation of U251 cells. (A) Chemical structure of xyloketal B; (B) Xyloketal B concentration-dependently reduced the cell viability of U251 cell line. U251 cells were incubated with xyloketal B (31.25–1000 μM) for 24 h, following MTT assay. * p < 0.05, n = 8 independent experiments; (C) Nonlinear curve fit for dose-response of xyloketal B treatment in U251 cells for 24 h. IC50 = 287.1 ± 1.0 μM; (D) Xyloketal B inhibited proliferation of U251 cell line. U251 cells were treated with xyloketal B for 24, 48, and 72 h, and then cell proliferation was detected by MTT assay; a, b, and c represent 75, 150, and 300 μm xyloketal B versus the control group, respectively, p < 0.05, n = 6 independent experiments; (E) Representative images of U251 cells with or without xyloketal B treatment for 48 h showed reduction of cell numbers in xyloketal B treatment group. Cell images were obtained with a digital camera connected to a phase-contrast Olympus microscope (CKX41, ×10 objectives). n = 3; (F) Xyloketal B inhibited colony formation of U251 cells. Cells were plated in six-well culture plates and treated with xyloketal B (300 μM) for 24 h. The culture medium was changed at regular time intervals. Colony formation of U251 cells was detected by crystal violet staining at seven days after xyloketal B treatment. Images were taken using a scanner (CanoScan LiDE 700F, left panel) and a digital camera connected to a phase-contrast Olympus microscope (CKX41, ×10 objectives, right panel). Colony numbers were calculated using Image-Pro Plus software. Representative images were shown. n = 3; (G) Statistic analysis of colony formation results. Xyloketal B significantly reduced the colony formation of the U251 cells. * p < 0.05, n = 3. All scale bars = 150 μm.


