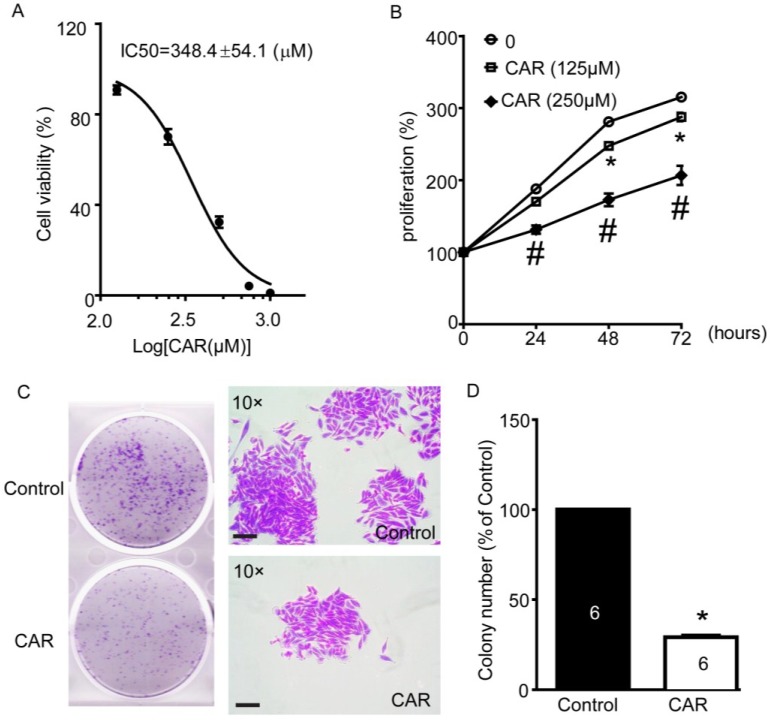
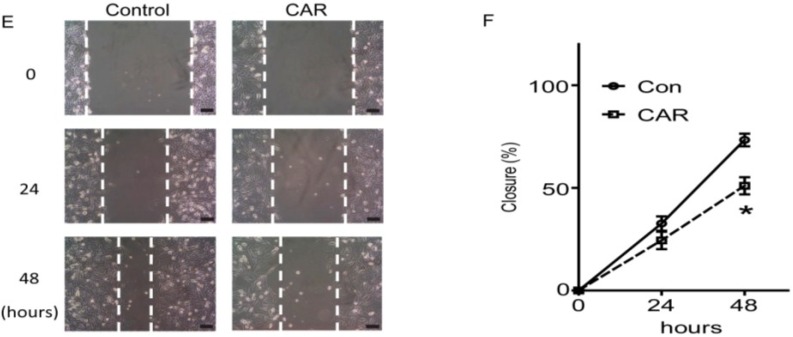
Figure 5.
Effects of TRPM7 inhibitor carvacrol (CAR) on viability, proliferation, and migration of U251 cells. (A) Carvacrol reduced the viability of U251 cells. U251 cells were treated with various concentrations of carvacrol for 24 h following detection with MTT assay. Nonlinear curve fitting for dose-response of carvacrol treatment was displayed and IC50 was calculated as 348.4 ± 54.1 μM. n = 8 independent experiments; (B) Carvacrol inhibited the proliferation of U251 cells. U251 cells were treated with carvacrol (125 and 250 μM) or vehicle control (0.1% DMSO) for 24, 48, or 72 h. Cell proliferation was measured using MTT assay. * p < 0.05, carvacrol (125 μM) group versus control group; # p < 0.05, cavarcrol (250 μM) group versus control group, n = 8 independent experiments; (C) Carvacrol inhibited colony formation of U251 cells. Cells were plated in six-well culture plates and treated with carvacrol (500 μM) for 24 h. Colony formation of U251 cells was detected by crystal violet staining at seven days after carvacrol treatment. Images were taken using a scanner (CanoScan LiDE 700F, left panel) and a digital camera connected to a phase-contrast Olympus microscope (CKX41, ×10 objectives, right panel). Colony numbers were calculated using Image-Pro Plus software. Representative images were shown. n = 6; (D) Statistic analysis of colony formation results. Carvacrol B significantly reduced the colony formation of the U251 cells. * p < 0.05, n = 6; (E) Carvacrol inhibited U251 cell migration. The representative images of wound healing were displayed. After being scratched with 200-μL pipette tip, U251 cells were treated with carvacrol (500 μM) or vehicle (0.1% DMSO), then images were taken at 0, 24, and 48 h and gap closure was analyzed; (F) Statistical analysis of migration results. Carvacrol significantly inhibited the cell migration of the U251 cells at 48 h timeline. * p < 0.05, n = 4. All scale bars = 150 μM.


