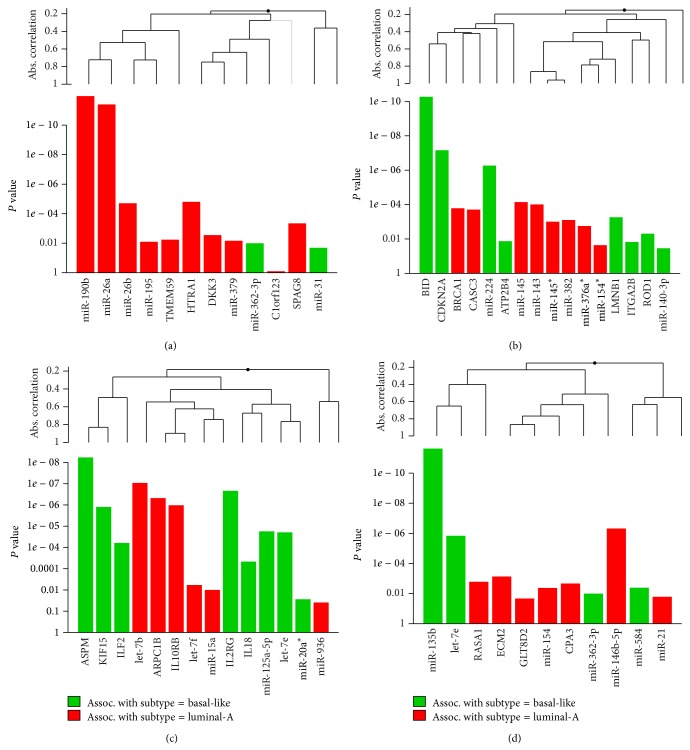
Figure 5.
Global test for 4 identified network motifs. (a) Luminal-A gain network motif; (b) luminal-A loss network motif; (c) basal-like gain network motif; (d) basal-like loss network motif. This graph is based on the decomposition of the test statistic into the contributions made by each of the genes (or miRNAs) in the alternative hypothesis. The graph illustrated the P values of the tests of individual component genes (or miRNAs) of the alternative. The plotted genes (or miRNAs) are ordered in a hierarchical clustering graph and the clustering method is average linkage.

