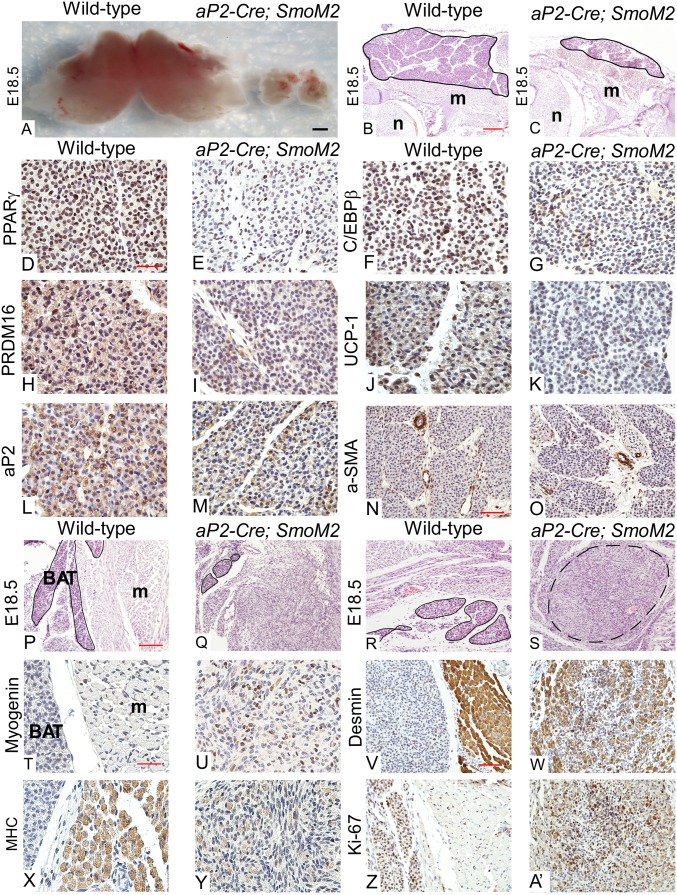
Fig. 2.
Hh signaling inhibits BAT development in vivo. (A) Intact interscapular BAT dissected from WT and aP2-Cre; SmoM2 embryos (n = 10 embryos). (Scale bar: 1,000 μm.) (B and C) H&E-stained E18.5 WT and aP2-Cre; SmoM2 mouse embryo sections. m, muscle; n, neural tube. Interscapular BAT is outlined in black. (Scale bar: 100 μm.) (D–O) IHC of E18.5 WT and aP2-Cre; SmoM2 interscapular BAT sections was performed using antibodies against PPARγ (D and E), C/EBPβ (F and G), PRDM16 (H and I), UCP-1 (J and K), aP2 (L and M), and alpha-smooth muscle actin (α-SMA) (N and O). PPARγ, C/EBPβ, and PRDM16 serve as brown-preadipocyte markers; UCP-1 and aP2 serve as mature brown fat markers; and α-SMA serves as a control (smooth-muscle marker). (Scale bars: D–M, 25 μm; N and O, 50 μm.) Quantitative analysis of the images is presented in Fig. S4. (P–S) H&E-stained E18.5 WT and aP2-Cre; SmoM2 mouse embryo sections of supraclavicular BAT (P and Q) and ventral neck BAT (R and S). BAT is outlined in black. A nodule composed of a mixture of differentiating skeletal muscle and spindled cells is outlined by a black dashed line. (Scale bar: 100 μm.) (T–A') IHC of E18.5 WT and aP2-Cre; SmoM2 supraclavicular brown-adipose sections using antibodies against Myogenin (T and U), Desmin (V and W), MHC (X and Y), and Ki-67 (Z and A'). (Scale bars: T, U, X, and Y, 25 μm; V, W, Z, and A’, 50 μm.) All images shown in this figure are representative of analyses of four embryos per genotype.

