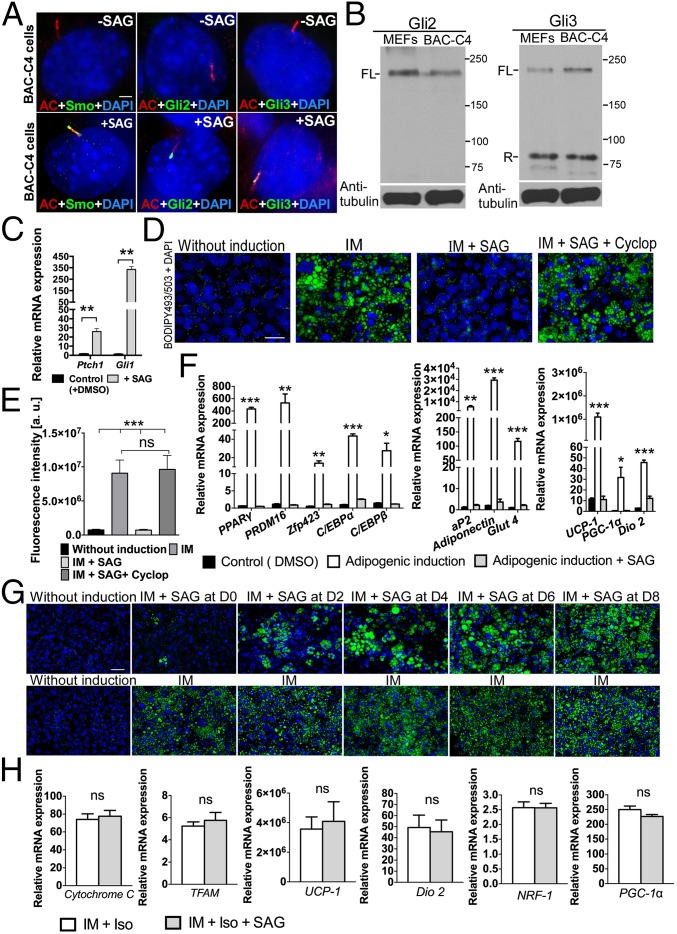
Fig. 3.
Hh signaling inhibits brown-adipocyte differentiation. (A) Double immunofluorescence staining using antibodies against acetylated tubulin (AC; red) and either Smo, Gli2, or Gli3 (green) in untreated and SAG-treated BAC-C4 cells (n = 3). (Scale bar: 10 μm.) (B) Western blot of Gli2 and Gli3 in WT MEFs and BAC-C4 cells. α-Tubulin was used as a loading control. FL, full length; R, repressor. (C) qRT-PCR analysis of Ptch1 and Gli1 in BAC-C4 cells treated with SAG relative to control cells (n = 3). Data are presented as mean ± SD; **P < 0.01. (D) BODIPY493/503 staining of BAC-C4 cells cultured with induction medium (IM), with IM and SAG, or with IM, SAG, and Cyclopamine (Cyclop). (Scale bar: 25 μm.) (E) Quantitative analysis of BODIPY493/503 staining (fluorescence intensity of images) of BAC-C4 cells (n = 4). Data are presented as mean ± SD; ***P < 0.001; ns, nonsignificant. (F) qRT-PCR analysis of brown-adipocyte differentiation markers (PPARγ, PRDM16, Zfp423, C/EBPα, C/EBPβ, and aP2), mature adipocyte markers (Adiponectin, and Glut4), and mitochondrial component markers (UCP-1, PGC-1α, and Dio2) in BAC-C4 cells supplemented with IM or with IM and SAG (n = 3). Data are presented as mean ± SD; ***P < 0.001; **P < 0.01; *P < 0.05; ns, nonsignificant. (G) BODIPY493/503 staining of BAC-C4 cells cultured as outlined in Fig. S6A. SAG was added for a 2-d interval at the indicated day after the start of induction (D0, D2, D4, D6, or D8). (Scale bar: 50 μm.) Quantitative analysis of these images is presented in Fig. S6F. (H) qRT-PCR analysis of genes involved in mitochondrial biogenesis and function in fully differentiated BAC-C4 cells treated with isoproterenol (Iso) or with Iso and SAG at the end of culture period. Data are presented as mean ± SD (n = 3). ns, nonsignificant.

