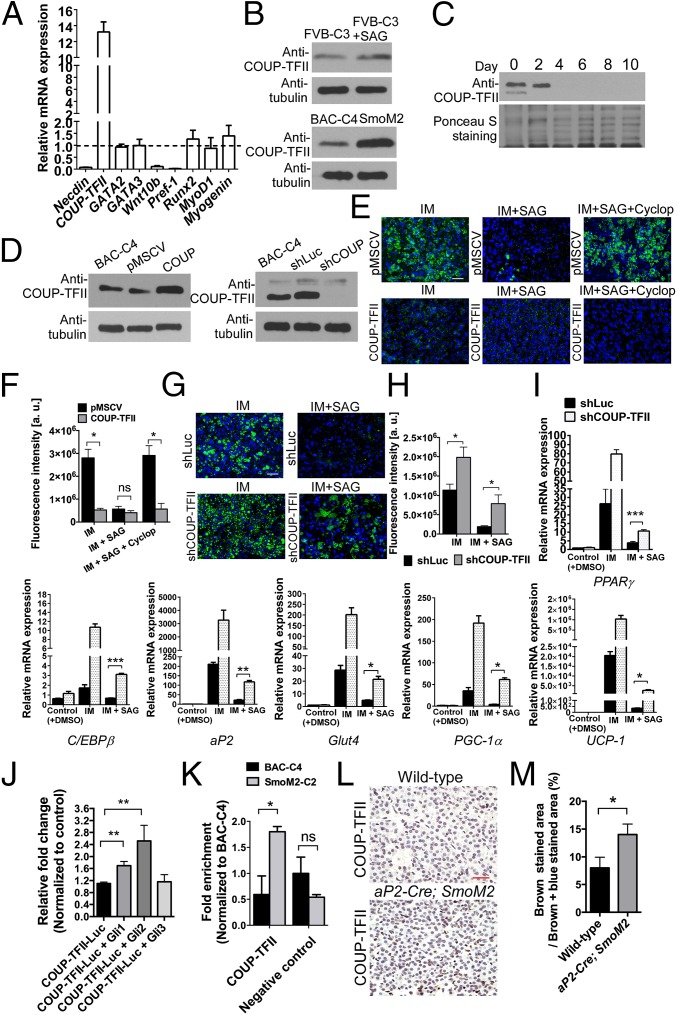
Fig. 4.
Hh signaling inhibits brown adipocyte differentiation by increasing COUP-TFII expression in brown preadipocytes. (A) qRT-PCR analysis of negative regulators of adipogenesis (Necdin, COUP-TFII, GATA2, GATA3, Wnt10b, and Pref-1) and of bone (Runx2) and skeletal muscle (MyoD1 and Myogenin) specific genes in SmoM2 cells relative to expression in untreated BAC-C4 cells. Data are presented as mean ± SD (n = 3). (B) Western blot analysis of COUP-TFII abundance in FVB-C3, BAC-C4, and SmoM2 cells (n = 4). COUP-TFII was normalized to α-tubulin. (C) Western blot analysis of COUP-TFII in BAC-C4 cells throughout the course of the 10-d differentiation period described in Fig. S6A. Ponceau S Staining was used to confirm loading of equivalent amounts of protein (n = 4). (D) Western blot analysis of COUP-TFII in BAC-C4 cells expressing retroviral pMSCV-COUP-TFII (COUP), pMSCV (empty vector, control), shRNA against COUP-TFII (shCOUP), and shRNA against Luciferase (shLuc, control). (E) BODIPY493/503 staining of BAC-C4 cells expressing the empty retroviral pMSCV vector or retroviral COUP-TFII. Cells were cultured with IM, IM and SAG, or IM, SAG, and Cyclopamine (Cyclop) (n = 4). (Scale bar: 50 μm.) (F) Quantitative analysis of BODIPY493/503 staining in BAC-C4 cells containing either pMSCV or retroviral COUP-TFII. Data are presented as mean ± SD (n = 4). *P < 0.05; ns, nonsignificant. (G) BODIPY493/503 staining of BAC-C4 cells expressing shLuc or shCOUP-TFII (n = 4). (Scale bar: 50 μm.) (H) Quantitative analysis of BODIPY493/503 staining in BAC-C4 cells expressing shLuc or shCOUP-TFII. Data are presented as mean ± SD (n = 4). *P < 0.05. (I) qRT-PCR analyses of brown-adipocyte differentiation markers in BAC-C4 cells expressing shLuc or shCOUP-TFII. Data are presented as mean ± SD; ***P < 0.001, **P < 0.01, *P < 0.05. (J) The Gli2 expression construct activates Luciferase reporter gene expression driven by a COUP-TFII promoter containing Gli binding sites (n = 3). Data are presented as mean ± SD; **P < 0.01. (K) ChIP analysis of Gli2 binding to the COUP-TFII promoter in BAC-C4 and SmoM2 cells. Data are presented as mean ± SD; *P < 0.05; ns, nonsignificant. (L) IHC of E18.5 WT and aP2-Cre; SmoM2 brown adipose sections using antibodies against COUP-TFII (n = 4). (Scale bar: 25 μm.) (M) Quantitative analysis of COUP-TFII–positive staining in WT and aP2-Cre; SmoM2 brown-adipose sections. Data are presented as mean ± SD (n = 4 embryos); *P < 0.05.

