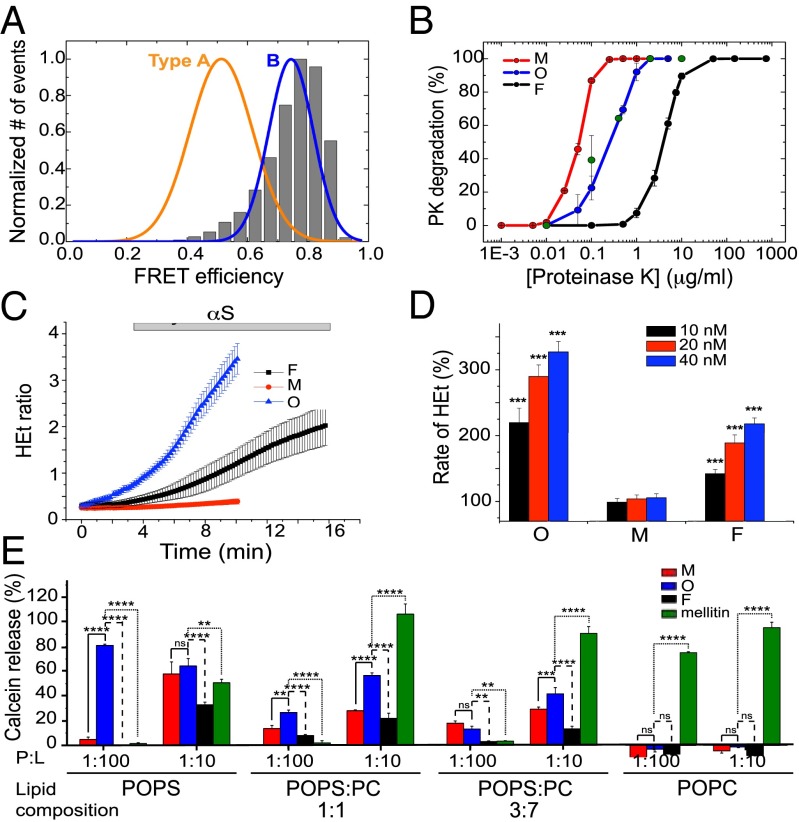
Fig. 5.
Comparison of the purified αS oligomers with toxic oligomers previously found during αS fibril formation. (A) The single-molecule FRET efficiency distribution of a purified αS oligomeric sample (shown in gray bars) compared with the FRET distributions of the two main oligomeric species (type A and type B) previously found during αS fibril formation. (B) Proteinase K degradation curves of the different protein species: monomers in red, oligomers in blue, and fibrils in black. The data represented correspond to the average and SE of three different experiments. The degradation profile of type B oligomers is shown by green circles. (C) Time-resolved cytoplasmatic ROS production (HEt: dihydroethidium) in rat midbrain neuronal cultures after exposure to the different αS species: monomers in red, oligomers in blue, and fibrils in black. (D) Dose–response effect of monomers (M), oligomers (O), and fibrils (F) on the rate of cytoplasmatic ROS production. The basal rate of ROS production was taken as 100%. ***P < 0.0001. (E) Calcein release from LUVs of different POPS:POPC ratios after being incubated with monomeric (red bars), oligomeric (blue bars), and fibrillar (black bars) αS, at two different protein:lipid ratios (1:10 and 1:100). The pore-forming peptide, melittin, was used as positive control (green bars). The signal obtained when the detergent Triton X-100 was added to the vesicles was taken as 100%. Data points are averaged triplicates, and the error bars represent the SDs. *P < 0.5; **P < 0.01; ***P < 0.001; ****P < 0.0001; ns, not significant.

