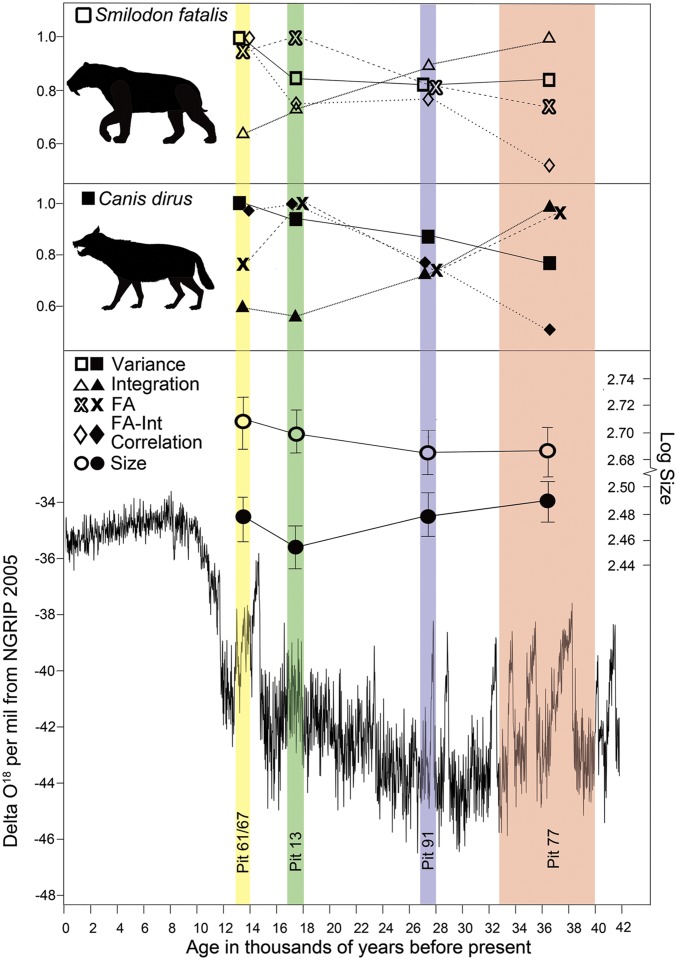
Fig. 3.
Temporal patterns in log centroid size, interindividual variance, FA, phenotypic integration, and the correlation between fluctuating asymmetry and overall integration for S. fatalis and C. dirus from the Rancho La Brea tar pits. Variance, FA, integration, and correlation are scaled relative to their maximum values. Unscaled values in Table S1. Data on pit ages from refs. 35 and 36. Delta O18 curve from ref. 67. Open symbols indicate S. fatalis; closed symbols indicate C. dirus. Silhouettes from phylopic.org.

