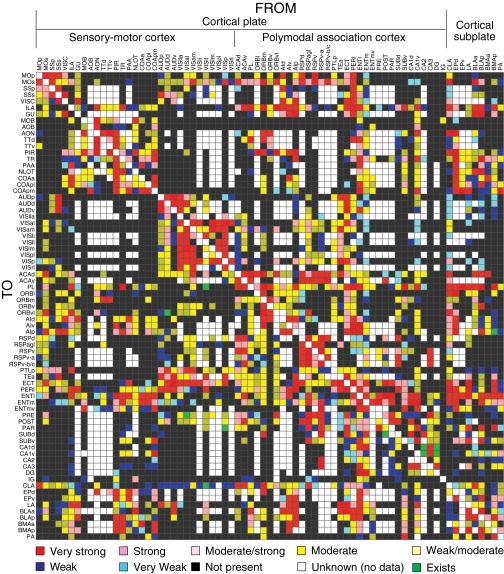
Fig. 1.
Rat cortical association connectome. Directed synaptic macroconnection matrix with gray-matter region sequence (top left to right, list of macroconnection origins, from; left side top to bottom, same list of macroconnection terminations, to) in the Swanson-04 (16) structure–function nomenclature hierarchy. The main diagonal (top left to bottom right) is empty because connections within a region are not considered in the analysis. Color scale of connection weight is at bottom; abbreviations are in Fig. S2.

