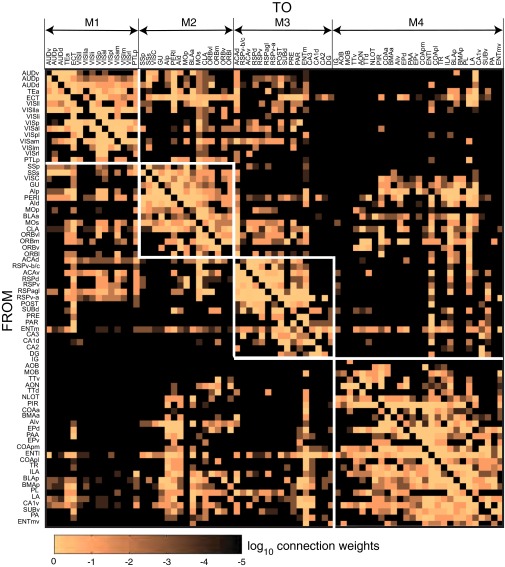
Fig. 2.
Four modules of rat cortical association network (M1–M4). Directed synaptic macroconnections are arranged here by connection weight, rather than by nomenclature hierarchy (Fig. 1). The matrix (log-weighted scaled connection weighs, bottom) shows four highly interconnected modules (inside white boxes along main diagonal) that together include all 73 regions in the analysis, with intermodular connections shown outside the boxes. “Not present” and “unknown” are black; abbreviations are in Fig. S2.

