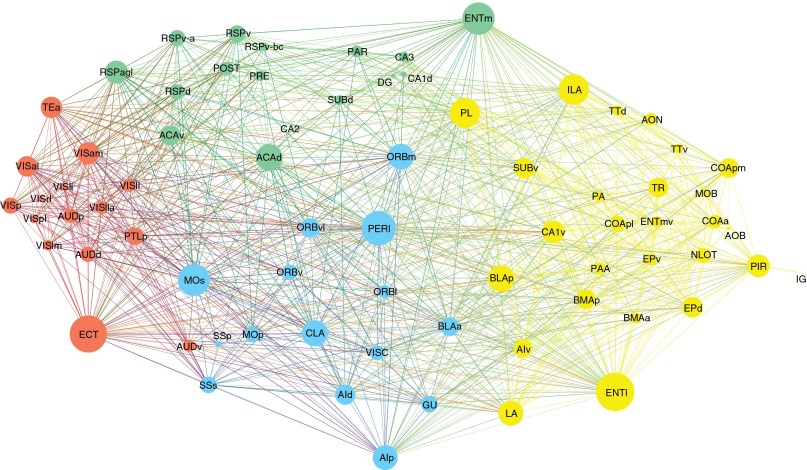
Fig. 3.
Circuit diagram constructed using Gephi’s weighted 3D force-directed algorithm. Node color indicates module number (M1, red; M2, blue; M3, green; M4, yellow), with size proportional to node degree (Fig. S1C). Edge color indicates output of correspondingly colored node; edge thickness is proportional to connection weight. “Very weak” and “weak” weights were dropped from analysis, minimizing the influence of false-positive results. Abbreviations are in Fig. S2.

