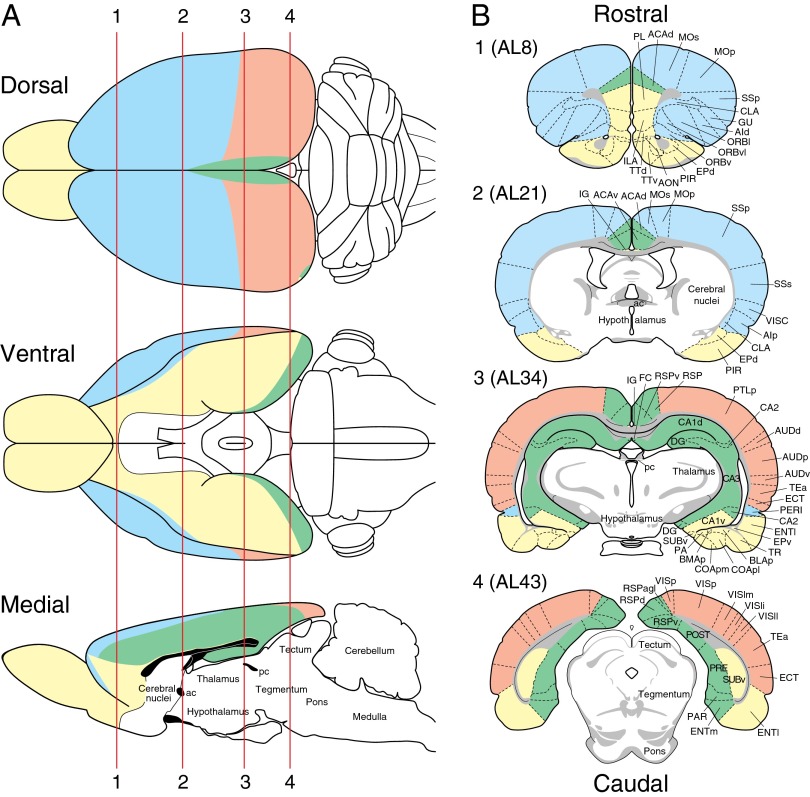
Fig. 5.
Module distribution on surface and transverse views. (A) Surface views of the rat brain with four RCAM module domains color coded as in Figs. 3 and 4. Four vertical red lines indicate transverse levels through the brain shown in B. (B) Four transverse levels through the rat brain with modules color coded as in A; specifically, Atlas levels (AL) 8, 21, 34, and 43 of ref. 16 are shown. ac, anterior commissure; pc, posterior commissure; all other abbreviations are in Fig. S2.

