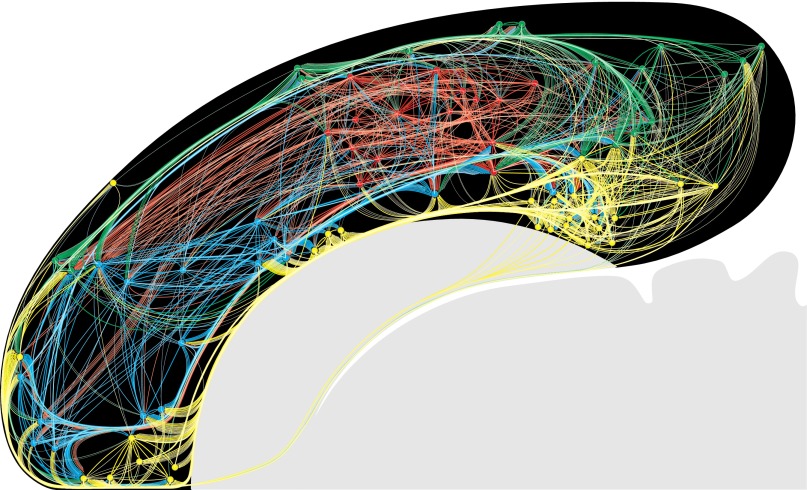
Fig. 6.
All 1,923 RCAMs mapped onto the flatmap and color coded as in Figs. 3 and 4. Connection routes were placed to follow known white-matter tracts (16) and/or to follow the shortest path between origin and termination nodes (circles), without crossing unrelated nodes between them, for clarity. For a high-resolution view with labeled nodes, see Fig. S4.

