Fig. 7.
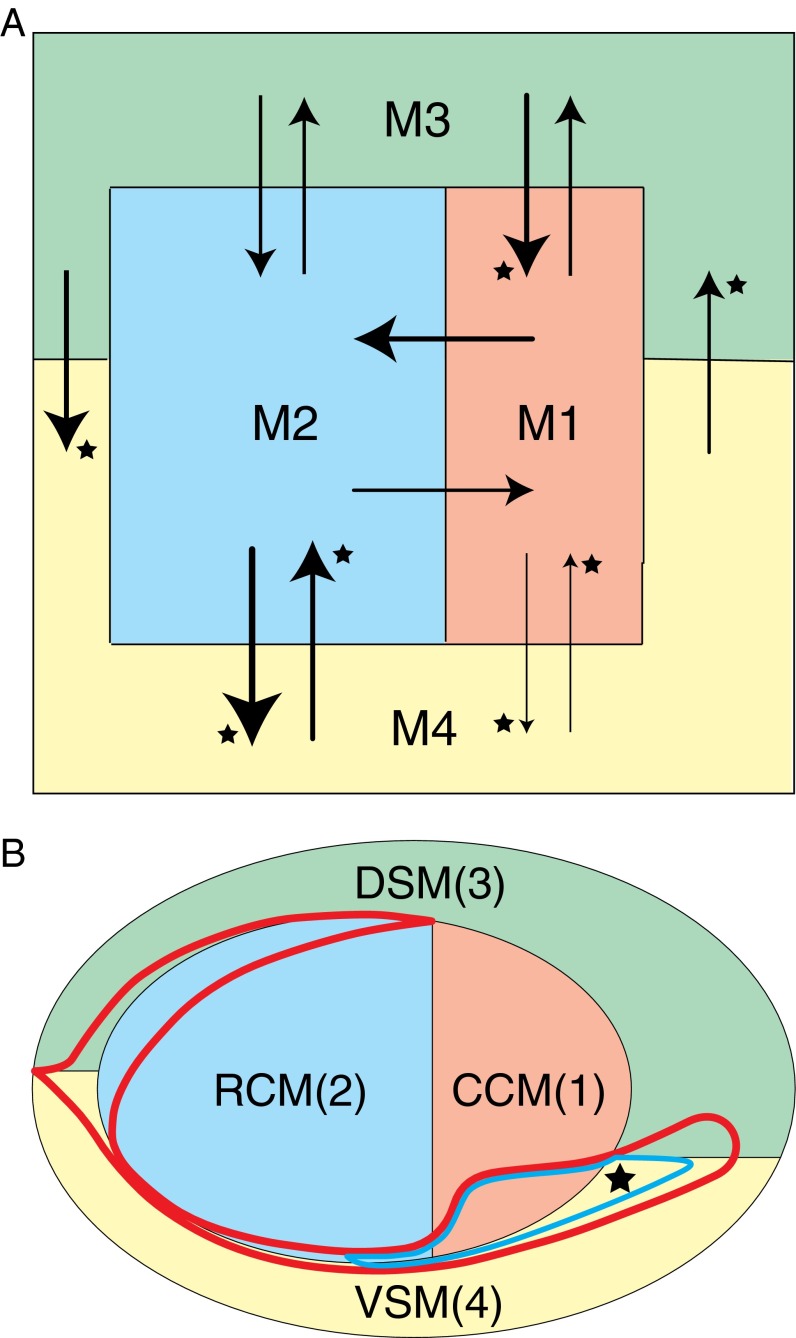
Basic logic of cortical association module organization. (A) Schematic diagram of topological relationships between cortical association modules M1–M4 (color-coded as in Figs. 4 and 5 and abstracted from the patterns in Fig. 4 and Fig. S3) with aggregate connection weights between them. Weight estimates are based on total connection number, scaled from 1 to 5 (indicated by line thickness); statistically significant differences (Table S3) are starred. (B) An alternate schematic view of topological relationship between modules M1–M4, rich-club regions (within thick red outline), and three highest ranked hubs (within thinner blue line with star, which indicates the most connected node of all, the lateral entorhinal area) nested in rich-club territory. The rich club and hubs are shown on the flatmap in Fig. S3C. CCM, caudal core module (M1, red); DSM, dorsal shell module (M3, green); RCM, rostral core module (M2, blue); VSM, ventral shell module (M4, yellow).

