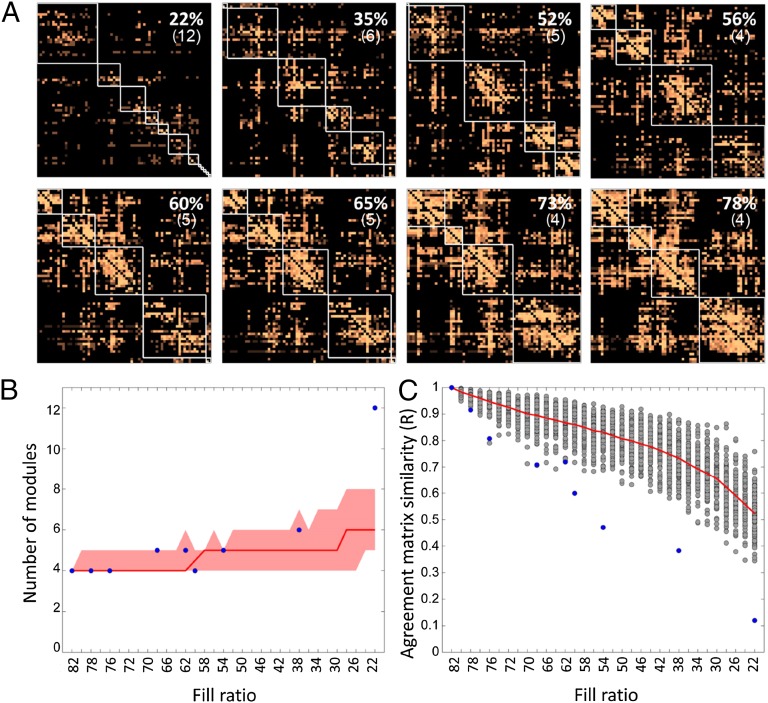
Fig. 8.
Data coverage effect on final connectome pattern. (A) Eight versions of cortical association connectome saved during curation with indicated percent coverage (fill ratio) and number of modules (in parentheses). Matrices are based on 69 regions because the total increased to 73 during the process of curation. (B) Empirical matrix module number (blue point at 81% coverage), eight less-covered matrices (remaining eight blue points), median module number for randomly degraded matrices (solid red line) with corresponding minimum (red shaded area lower bound) and maximum (red shaded area upper bound). (C) Agreement matrix similarities between empirical matrix (81% coverage) and eight incompletely covered matrices (blue points) and randomly degraded matrices (gray points), expressed as Pearson correlation of upper matrix triangles.

