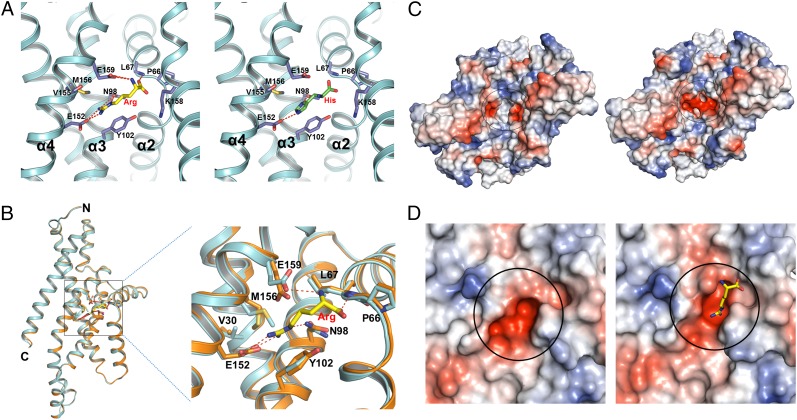
Fig. 4.
Comparison of conformational changes of the substrate-binding site in the apo-bound and Arg-bound states. (A) Stereo views of the Arg (Left) and His (Right) binding site, with hydrogen bonds indicated by red dashed lines. ArtQ is colored in cyan; Arg and His are shown in yellow and green sticks, respectively; and residues interacting with substrate are shown as blue sticks. (B) Relative positions of the residues in the substrate-binding site (indicated by a black square) display slight changes by superposition of the two ArtQ subunits in different states. Apo-bound and Arg-bound ArtQ subunits are colored in yellow and cyan, respectively. Arg is shown in ball-and-stick models. Hydrogen bonds are represented as red dashed lines. (C) Comparison of overall electrostatic potential surface of the substrate-binding site (indicated by a black circle) between apo-bound (Left) and Arg-bound (Right) states. Representative model of Arg is as in A. (D) Close-up of the electrostatic potential surface of the substrate-binding site of apo-bound (Left) and Arg-bound (Right) states.

