
Fig. 3.
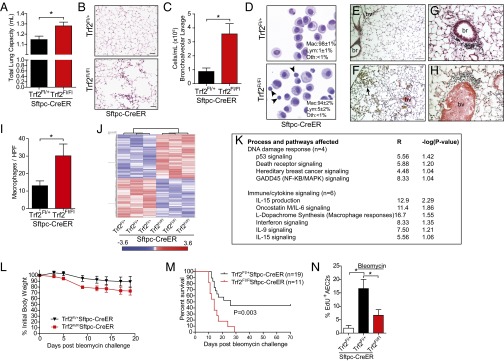
Telomere dysfunction in AEC2s recruits inflammation and impairs repair after injury. (A–I) Trf2Fl/+;Sftpc-CreER and Trf2Fl/Fl;Sftpc-CreER mice were treated with tamoxifen and examined 21 d later. (A) Total lung capacity (n = 6–8 mice per group). (B) High-power image of air space enlargement seen occasionally in Trf2Fl/Fl;Sftpc-CreER mice. (Scale bars: 50 µm.) (C) Bronchoalveolar lavage cellularity. (D) Representative Cytospin images showing macrophages and lymphocytes (marked by arrowheads). (Insets) Differential counts. For C and D, n = 5 mice per group. For differential counts, 250 cells were counted per mouse. (E–H) Representative images from control (E) and Trf2-deleted lungs showing pigmented macrophages (F, arrow) and peribronchiolar (G), and perivascular (H) inflammation. (Scale bars: 100 µm in E and F; 25 µm in G and H.) br, bronchiole; bv, blood vessel. (I) Macrophage quantification per high-powered field (HPF) by Mac-3 immunohistochemistry (n = 4 or 5 mice per group; P value is one-sided). (J) Heat map of gene-expression microarray data from purified AEC2s from Trf2Fl/+;Sftpc-CreER and Trf2Fl/Fl;Sftpc-CreER mice (n = 3 mice per group) 7 d after tamoxifen. Red indicates up-regulated genes; blue indicates down-regulated genes. The fold-change based on color is shown in the key below. (K) Pathways identified by Ingenuity analysis of the up-regulated genes. P is calculated by Fisher’s exact test (right-tailed); R is the ratio of the number of genes in the indicated pathway divided by the total number of genes that make up that pathway. (L and M) Mice treated with tamoxifen 1 wk before bleomycin challenge, were weighed every other day (L), and their survival was monitored (M). The log-rank test was used in the Kaplan–Meier survival analysis. (N) EdU incorporation of AEC2s following bleomycin challenge. Mice were challenged with bleomycin and injected with EdU for 3 d before harvest on day 14 (n = 5 mice per group). Data are expressed as mean ± SEM. *P < 0.05. Unless otherwise noted, Student’s t test was used to calculate P values.