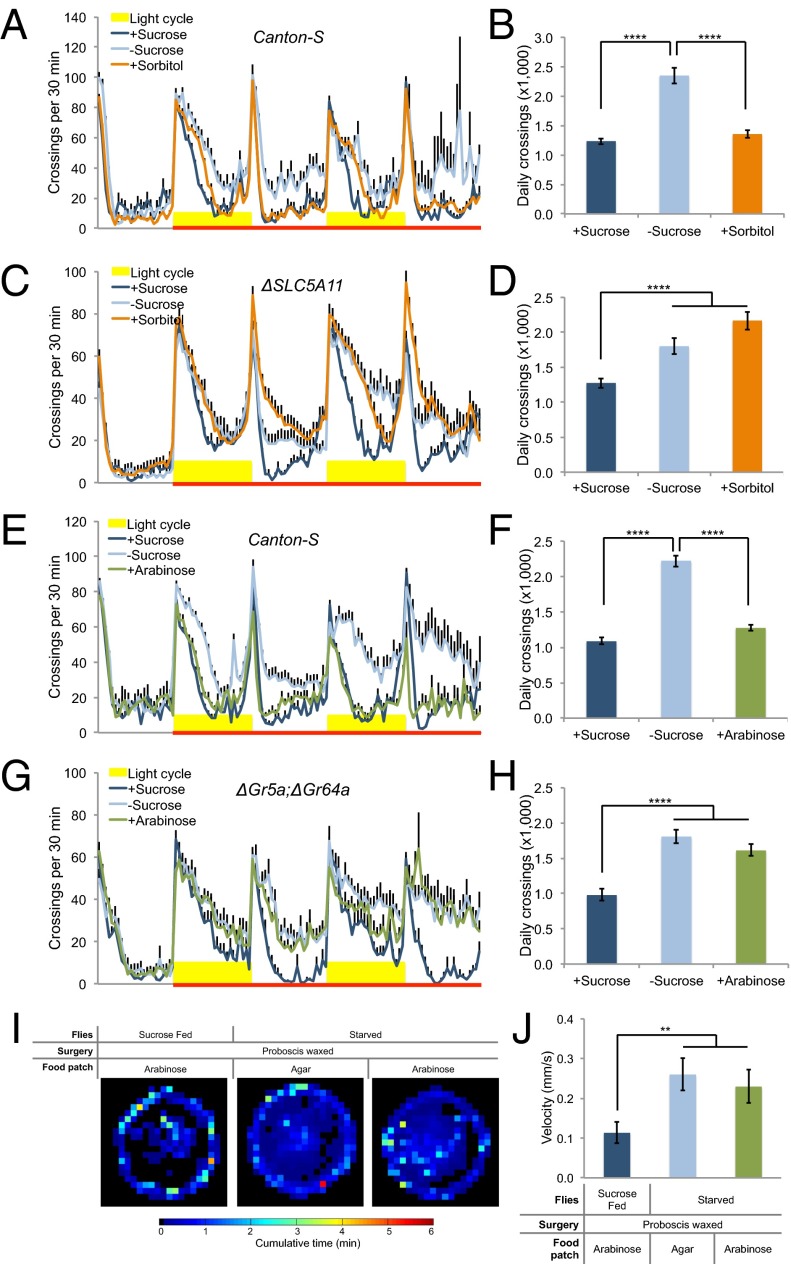
Fig. 2.
Food cues suppress starvation-induced hyperactivity. (A, C, E, and G) Midline crossing activity of indicated genotype assayed in the presence of 100 mM sucrose, 3 M sorbitol, 100 mM arabinose, and agar only (n = 32–64). (B, D, F, and H) Average daily midline crossing activity of flies assayed in A, C, E, and G. (I) Spatial distribution of sucrose-fed Canton-S flies assayed in the presence of 100 mM arabinose (Left), starved flies assayed in the presence of agar only (Middle), and 100 mM arabinose (Right) (n = 17–21). Color temperature represents average time spent on each pixel for the duration of the assay (2 h). Note that the proboscis of these flies was waxed to prevent fluid ingestion before the assay. (J) Average walking velocity of flies assayed in I. Error bars represent SEM. One-way ANOVA (B, D, F, H, and J) was applied for statistical analysis. NS, P > 0.05; **P < 0.01; ****P < 0.0001.

