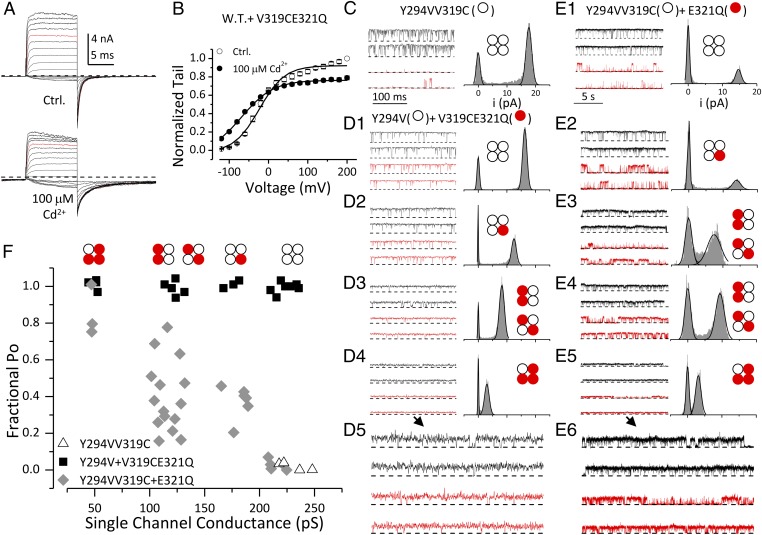
Fig. 3.
Cd2+ coordinates with V319C and E321 from the same subunit. (A) Macroscopic BK currents recorded from oocytes coinjected with WT and V319CE321Q RNAs without (Upper) and with (Lower) 100 μM intracellular Cd2+. Voltage protocol was the same as in Fig. 1. (B) G–V relationships of WT + V319CE321Q in 300 μM Ca2+ without (open symbols) and with (filled symbols) 100 μM Cd2+. Boltzmann fit results (line) are z = 0.9e, Vh = −23 mV (control); z = 0.6e, Vh = −68 mV (Cd2+). (C–E) Representative single-channel currents of homomeric and heteromeric BK channels recorded in 300 μM Ca2+ at +70 mV without (black) and with (red) 100 μM Cd2+. Closed-channel level is indicated by dotted lines. All-point amplitude histogram on the right of each pair of sample traces was generated from recording in 4 μM Ca2+ from the same patch. (Insets) Stoichiometry for channel deduced from the single-channel current amplitude. The time scale in E1–E5 (5 s) is different from that in C and D1–D4 (100 ms). The single-channel traces in D4 and E5 are magnified (2×) and displayed in D5 and E6, respectively. (C) Single-channel activity of homomeric Y294VV319C channel. (D1–D5) Single-channel recordings for the four levels of observed currents recorded from oocytes coinjected with Y294V and V319CE321Q. (E1–E6) Single-channel recordings for the four levels of observed currents recorded from oocytes coinjected with Y294VV319C and E321Q. Notice that examples in E3 and E4 have similar single-channel conductance but distinct Cd2+ sensitivity. (F) The fraction of BK Po in 100 μM Cd2+ (PoCd/PoCtrl) is plotted against single-channel conductance of channels formed by Y294VV319C alone (triangle), coinjection of Y294V and V319CE321Q (square), and coinjection of Y294VV319C and E321Q (diamond). Po was determined from steady-state recordings of 5- to 10-s (Y294VV319C and Y294V + V319CE321Q) or 30- to 90-s (Y294VV319C + E321Q) duration.

