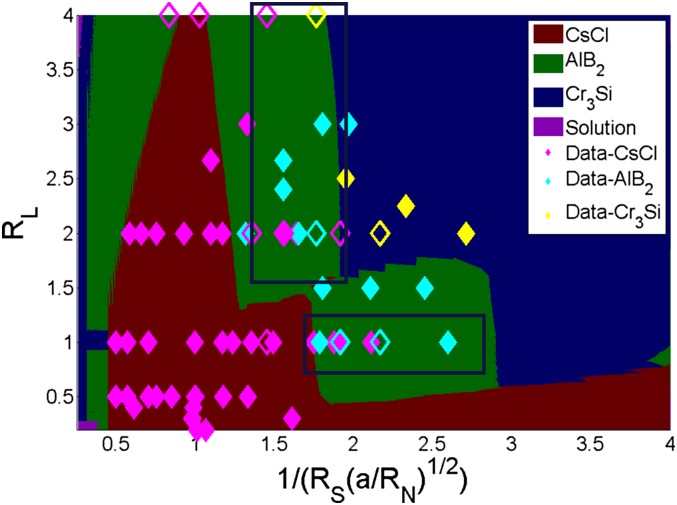
Fig. 5.
Generalized phase diagram. Scatter points represent experimental data: filled: pure, open: mixed or disordered. Mixed indicates predominantly indicated phase with traces of others. General agreement with experimental data observed at all stoichiometry, size, and linker ratios. Regions within blue boxes show some degree of experimental confusion between CsCl and .

