Fig. 3.
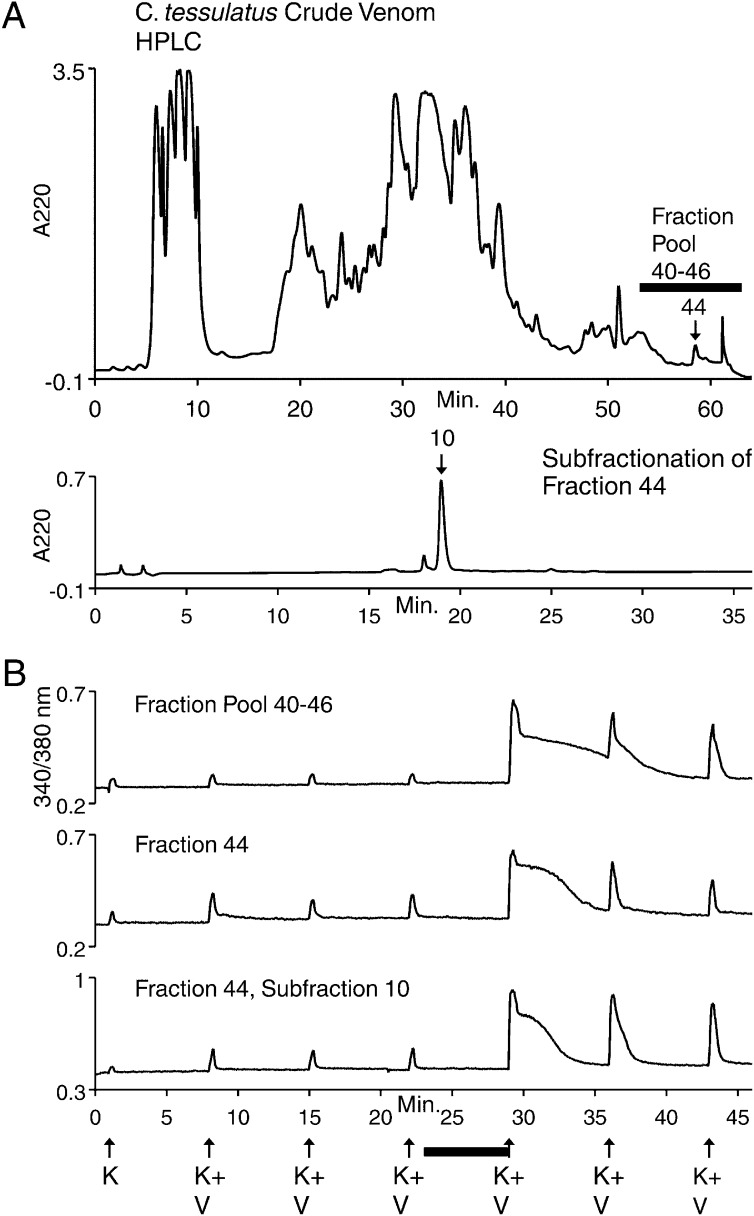
Bioassay-guided purification of δ-conotoxin TsVIA from C. tessulatus venom. (A, Top) Reversed-phase HPLC chromatogram of C. tessulatus crude venom. The biological activity was first identified in fraction pool 40–46 and then in fraction 44. (Bottom) Subfractionation of fraction 44 resulted in one main peak (subfraction 10) containing a single peptide that retained the biological activity observed in fraction 44. (B) Calcium-imaging traces from selected DRG neurons. Each trace represents the responses of a single neuron. The experimental protocol shown under the x axis is as follows. Each arrow represents a 15-s application of either 20 mM K+ (K) or 20 mM K+ + 20 μM veratridine (K+V) to depolarize the neurons. Upward deflection of the trace represents an increase in cytosolic calcium concentration. K+V was used in screening venom fractions to facilitate the discovery of antagonists of voltage-gated Na channels. The horizontal bar indicates when the venom fraction was present in the bath solution. Each venom fraction caused a substantial enhancement of the amplitude and duration of the response to a depolarizing stimulus (K+V), which was slowly reversible.

