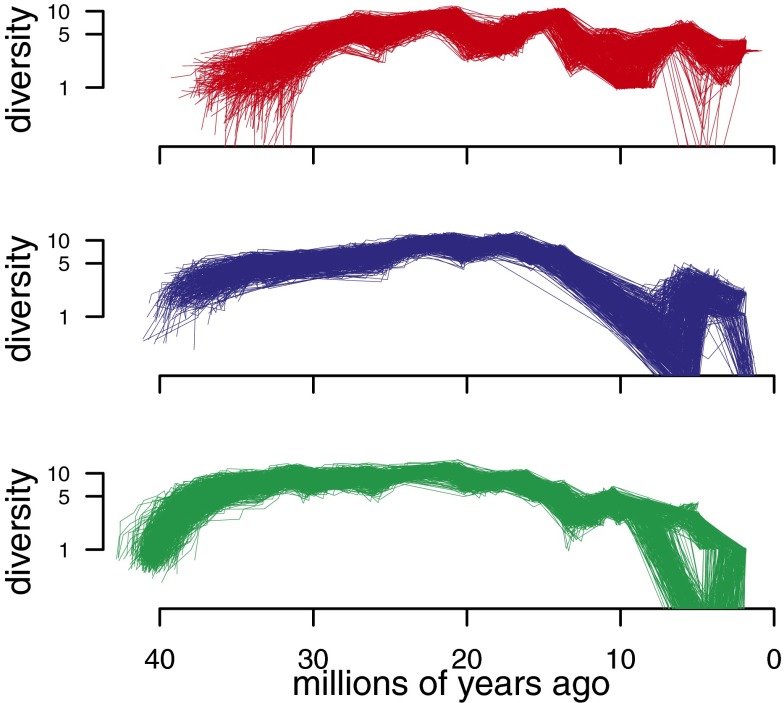
Fig. 3.
Plots of diversity through time for hypercarnivores (Top), mesocarnivores (Middle), and hypocarnivores (Bottom), estimated using the method of Mahler et al. (21). Diversity is computed from marginal ancestral state estimates, and is therefore more conservative than are raw species counts with respect to uncertainty in dietary history. Trajectories are computed for 500 trees from the Bayesian posterior distribution to accommodate the effects of phylogenetic uncertainty. Note the logarithmic scale on the ordinate, rendering semilog plots.

