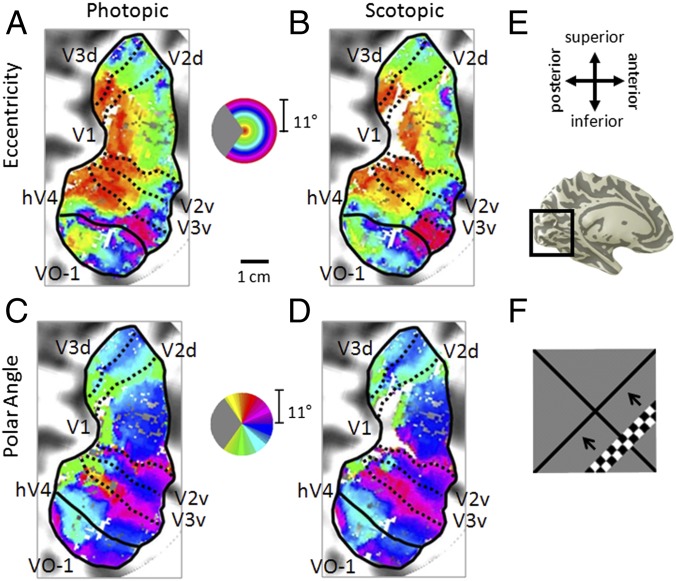
Fig. 2.
Visual field maps in photopic and scotopic conditions. (A–D) Pseudocolor overlays on a flattened representation of occipital cortex from the left hemisphere of one subject (S2) represent the position in visual space that produces the strongest response at that cortical location. (A and B) Eccentricity representations. Color legend represents the visual field from 0° to 10° radius of visual angle. (C and D) Polar angle representations. Color legend represents the contralateral hemifield. (A and C) Photopic measurements. (B and D) Scotopic measurements. Boundaries of visual field maps are depicted with dotted (polar angle boundaries between maps of interest) and solid (eccentricity boundaries and edge of measurement) black lines. Coherence ≥ 0.20. (Scale bar: 1 cm along the flattened cortical surface.) (E, Upper) Anatomical orientation legend. (E, Lower) Inflated 3D representation of a medial view of the left hemisphere of subject 2. Inset indicates the region near the calcarine sulcus of the occipital lobe, where the maps were measured. (F) Moving bar stimulus for visual field map and pRF measurements comprised a set of contrast-reversing checkerboard patterns at eccentricities from 0° to 11° radius. One frame is shown for the bar stimulus sequence. Four bar orientations (0°, 45°, 90°, and 135° from vertical) with two motion directions orthogonal to each orientation were used, producing eight different bar configurations. Additional examples are in Fig. S2.

