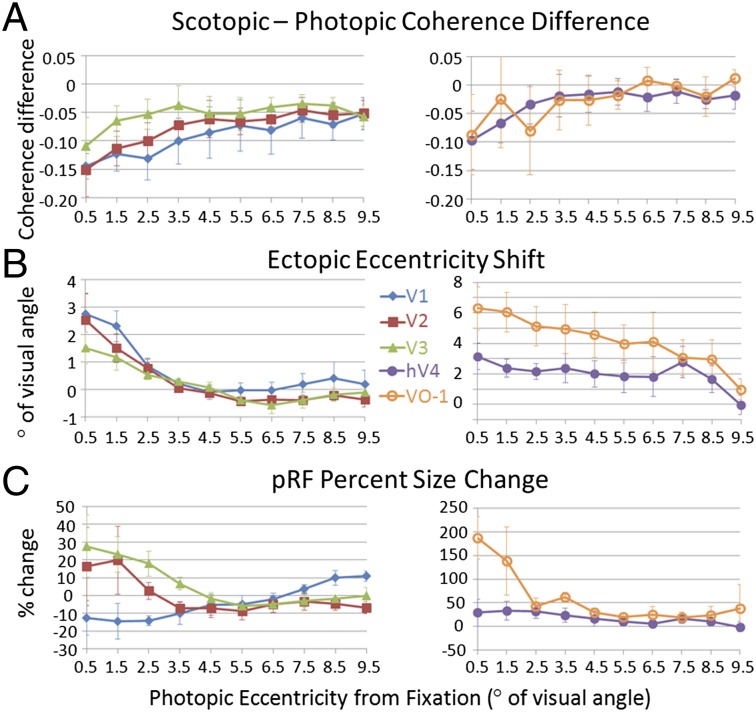
Fig. 3.
Coherence, eccentricity shifts, and pRF size changes in central and peripheral eccentricities. (A) Coherence differences. (B) Ectopic eccentricity shifts. Positive numbers indicate shifts of pRF centers outward from the rod scotoma, and negative numbers indicate shifts of pRF centers into the rod scotoma. (C) Scotopic pRF size percentage changes. Positive values indicate larger pRF sizes under scotopic conditions, whereas negative values indicate smaller pRF sizes under scotopic conditions. All data are plotted as a function of the photopic eccentricity in degrees of visual angle. The legend indicates line shading and marker shape for each map. Error bars represent SEMs (Figs. S5–S7).

