FIGURE 6.

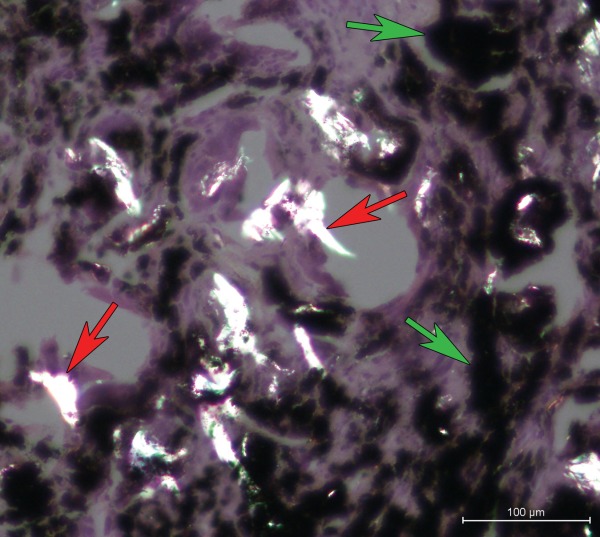
Polarization microscopy image (H&E, 20×) showing birefringent PE particles (red arrows) in the tissue (case no. 9). Metal degradation products appear in black (green arrows).

Polarization microscopy image (H&E, 20×) showing birefringent PE particles (red arrows) in the tissue (case no. 9). Metal degradation products appear in black (green arrows).