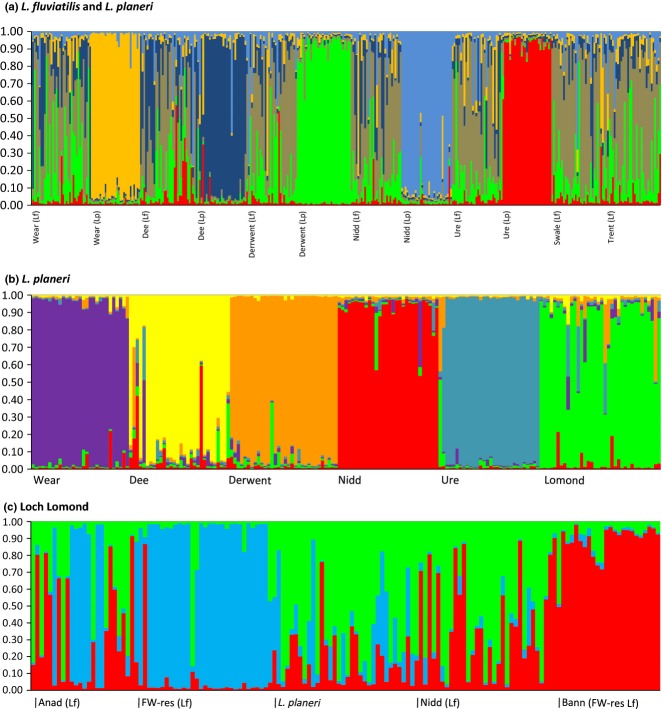
Fig 4.
structure bar plot generated from microsatellite data for three population clusters of lampreys. (a) Comparison between Lampetra fluviatilis and Lampetra planeri populations (K = 6); (b) L. planeri populations (K = 6); (c) Loch Lomond populations compared to a population of L. fluviatilis from the Humber catchment and freshwater-resident L. fluviatilis populations from the R. Bann in N. Ireland (K = 3). Please see the open-access online paper for a colour version of this figure.

