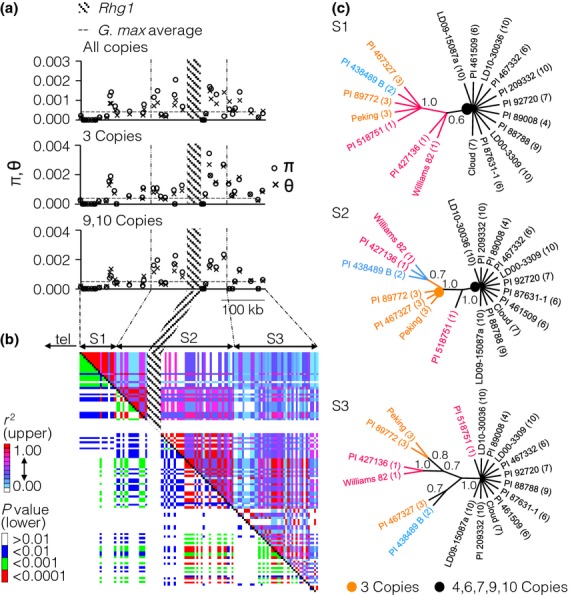
Fig 3.

Diversity, linkage disequilibrium (LD) and sequence analysis of the region surrounding the Rhg1 locus. (a) Nucleotide diversity within 38 protein-coding genes surrounding Rhg1 in eighteen germplasm accessions (with 1–10 copies at Rhg1) is displayed in the uppermost graph. Those accessions with three copies (centre graph) and nine and ten copies (bottom graph) were also analysed separately. The average nucleotide diversity (π; 0.00053) of all coding regions in Glycine max is marked by a horizontal line. (b) LD plot using the r2 metric for the 400-kb region surrounding the Rhg1 locus. The same 18 accessions were used. Regions S1, S2 and S3 represent three linkage blocks used in further analysis. tel: telomere. (c) Phylogenetic trees derived from parsimony analysis of the three LD blocks. The tree for the region of linkage block S2 that contains Rhg1 is consistent with the analysis of the repeat sequence (Fig.2). The copy number of each accession is in parentheses. The consensus trees were created after collapsing branches with bootstrap values <60%, based on 10 000 replications. The orange and black circles indicate nodes that differentiate the three-copy and 4- to 10-copy versions of the Rhg1 locus. Bootstrap support values are shown above key nodes.
