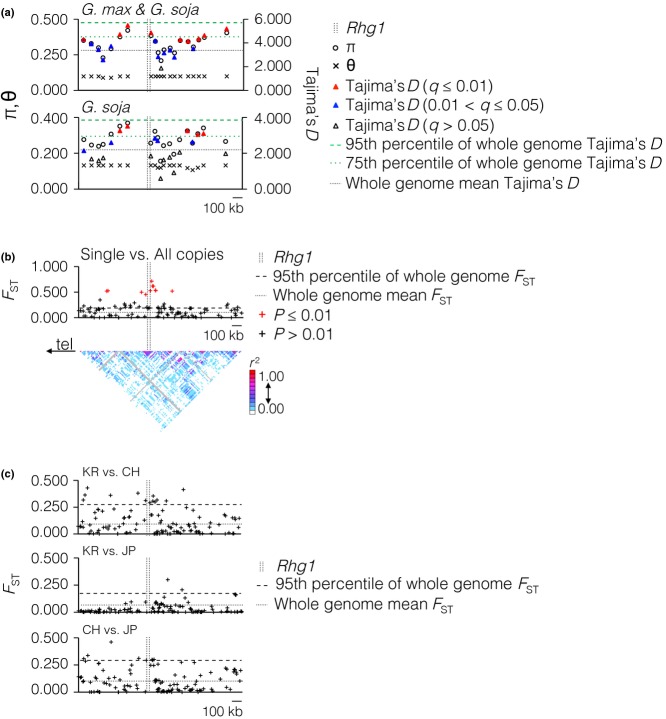
Fig 4.
Signatures of selection at the Rhg1 locus. (a) Nucleotide diversity (π and θ), Tajima's D and linkage disequilibrium were measured in the 1.5-Mbp region across the locus in 19 548 accessions (18 383 Glycine max & 1165 Glycine soja). The mean and 75th and 95th percentiles of whole-genome Tajima's D are marked by horizontal lines in corresponding graphs. (b) FST was calculated for lines with experimentally determined copy number (46 single copy vs. 48 multiple copy). Direction of telomere = ‘tel’. The mean and 95th percentile of whole-genome FST are marked by horizontal lines. Red marks indicates statistical significance. (c) FST between geographic subpopulations. One hundred and thirty-five single nucleotide polymorphisms were used to compare: Top graph, between 3311 germplasm accessions from Korea and 3855 from China; centre, between 3311 from Korea and 2466 from Japan; bottom, between 3855 from China and 2466 from Japan. The mean and 95th percentile values of whole-genome FST are marked by a horizontal line in the corresponding graphs.

