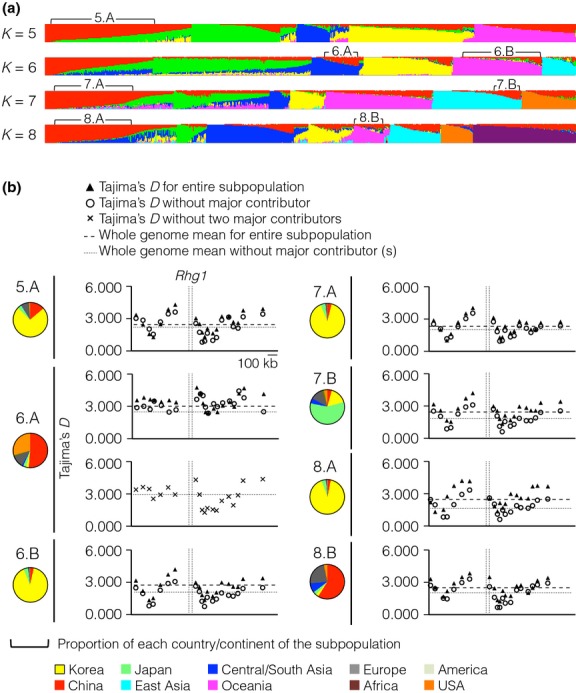
Fig 5.

Signatures of selection at the Rhg1 locus are independent of population demography. (a) soybean population clustered by genetic structure. Each individual is represented by a thin vertical line, which is partitioned into K coloured segments that represent the individual's estimated membership fractions in K clusters. Selected clusters were labelled according to the K value and by ‘A’ or ‘B’ if two clusters were selected from a given value of K (e.g. ‘6.A’ means one of the two subpopulations selected from the K = 6 analysis). (b) Neutrality in subpopulations with shared genetic structure was tested by Tajima's D. The pie chart represents the geographic origin of the members of each subpopulation. Two separate D values are displayed for each subpopulation: one calculated from all accessions and one calculated excluding accessions from the largest single geographic origin in the cluster. An additional test without either Chinese or USA accessions was performed on the 6.A subpopulation. The East Asia group represents countries other than Korea, Japan and China. America represents South and North America except the USA. The whole-genome mean Tajima's D of each subpopulation is marked by a horizontal line.
