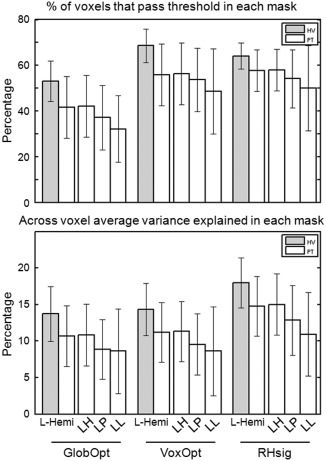
Figure 2.

The three analyses methods (GlobOpt, VoxOpt and RHsig) were compared across different masks for Sess1 (similar results were found for Sess2): the L‐Hemi mask for both the HV and PT groups and the L‐Healthy (LH), L‐PeriInfarct (LP) and L‐Lesion (LL) masks for the PT group. Grey bars depict the HV results and white bars the PT results (bars show means, error bars show standard deviations). The top panel shows the percentage of voxels in each mask that passed the liberal fitting threshold (R2 = 0.0288, P = 0.05, no correction for multiple comparisons) averaged across subjects in each group. The bottom panel shows the across voxel average variance explained in each thresholded mask, averaged across the subjects in each group.
